The railroad stocks were hit hard Monday as investors feared lower crude production would impact their bottom lines, so MoneyShow’s Tom Aspray takes to the charts to see if this has created any good buying opportunities.
The stock market had an early ugly start to the new month, though, by the close, the losses were not that severe. Market internals were 3-1 negative, which dropped the McClellan oscillator to -148 as the zero line was decisively broken. Now in a short-term downtrend, but already approaching initial oversold levels.
The Dow Transports suffered one of the largest losses as it was down 2.71% followed by a 1.34% drop in the Nasdaq Composite. This was equal to the losses in the small-cap indices like the S&P 600. Crude oil did close higher, which was not surprising given its current technical status, but the oil services stocks were still down sharply on the day.
The railroad stocks were hit hard Monday as investors feared lower crude production would impact the railroads bottom line as they would be shipping less oil. Union Pacific (UNP) was down 4.9%, CSX Corp. (CSX) lost 3.9%, and Canadian Pacific (CP) dropped 8% on the day.
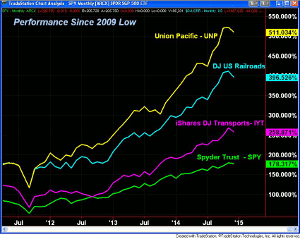
The transportation sector has been a favorite since the start of the bull market as—since the 2009 low—the iShares DJ Transports (IYT) is up 258%, clearly outperforming the Spyder Trust’s (SPY) gain of 178%.
As the chart indicates, the DJ Railroads (DJUSRR) has done even better, gaining 396% and it continues to be a favorite as we head into 2015 as it is a good leading economic indicator. Union Pacific (UNP) has been one of the strongest railroads showing a 511% increase since the bear market lows. This is almost double the gain of the Transports.
Therefore, the current setback, though it could go further, is likely to be a good buying opportunity to put one of the top railroad stocks in your portfolio. It is important to note that not all the rail or rail-related companies show bullish long-term patterns.
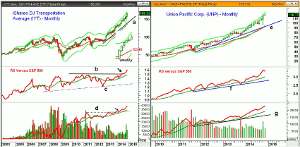
Chart Analysis: The monthly chart of iShares DJ Transportation (IYT) shows that it closed last week just below the monthly starc+ band at $166.60.
- The monthly low was $155.78, with the uptrend, line a, in the $140 area.
- The insert of the weekly chart shows that a lower weekly close will likely complete a short-term top. The 20-week EMA is now at $153.70, which is 4% below Monday’s close at $160.81.
- The monthly projected pivot support is at $158.41 with the weekly starc- band at $150.57.
- The monthly relative performance broke out to the upside early in 2014 as the resistance at line b, was overcome.
- Its WMA is still rising strongly, which is consistent with a long-term market leader.
- The monthly OBV also looks very strong as it began a new uptrend in late 2013.
- There is initial resistance now in the $165 area.
Union Pacific (UNP) surged above its monthly starc+ band in November and formed a doji. A December close below $114.33 will trigger a LCD at the end of the month.
- UNP reversed sharply to the downside last Friday, which turned the daily studies negative.
- The monthly projected pivot support at $113.03 is now being tested.
- There is further monthly support at $105-$110, with the uptrend, line e, at $93.
- This is just below the October low of $95.78.
- The monthly relative performance did make a new high with prices in November.
- The RS line is well above its rising WMA and the support at line f.
- The monthly on-balance volume (OBV) also continues to look very strong and is confirming prices.
- The weekly OBV (not shown) also is still clearly positive and is above its rising WMA.
- The monthly pivot and declining 20-day EMA are now in the $118 area.
NEXT PAGE: Two More Transport Stocks to Watch
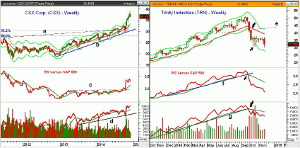
|pagebreak|The weekly chart of CSX Corp. (CSX) gives a bit clearer picture of what type of correction might be expected. CSX had tested its weekly starc+ band for the prior six weeks.
- CSX is up 24.05% YTD, despite its one week drop of over 7%.
- The next support is in the $33.50-$34.50 area with the quarterly pivot at $31.08.
- The long-term chart support, line a, connects the 2008 and 2011 highs and is also in the $31 area.
- The 38.2% Fibonacci retracement support from the 2011 low is at $29.67.
- The major 50% support is at $27.13.
- The weekly RS line did move above resistance (line c) in early September.
- The weekly OBV did confirm the recent highs and has strong support now at line d.
- The monthly pivot and initial resistance is now at $36.24.
Trinity Industries (TRN) is a $4.7 billion maker of railroad cars, as well as other marine and structural products. The stock has been hit hard over the past three months as it is down 36.79%, but is still up 13.10% YTD.
- The chart shows that the key support, at line e, was broken in early October.
- The weekly starc- band was tested over the next three weeks.
- For December, the monthly projected pivot support is at $26.52 while the starc- band is at $27.52.
- The weekly RS line dropped below support, line f, one week ahead of prices.
- It has continued to drop sharply, which is a sign of weakness.
- The OBV also violated its support, line g, before the violation of key price support.
- It continues to act weak and shows no signs yet of a bottom.
- The monthly OBV did confirm the August highs and is now testing its WMA.
- The monthly pivot is now at $33.08 with the 20-day EMA at $34.96.
What it Means: The recent weakness confirmed by a lower close this week would typically mean a decline for another few weeks in the iShares DJ Transportation (IYT), Union Pacific (UNP), and CSX Corp. (CSX). This should set up a good buying opportunity later in the month or even early next year. I would expect the major support for IYT in the $150-$154 area to hold.
I would expect Trinity Industries (TRN) to also rebound next year. Since it has already been hit hard, it may now be closer to a bottom, but there are no signs yet.
How to Profit: No new recommendation.


