On Monday, the money flow analysis turned positive on crude oil for the first time since last summer, so MoneyShow’s Tom Aspray takes to the charts to determine how high crude oil can go and what this means for the energy stocks.
Despite last week’s ugly close, the stock market put in an impressive performance on Monday as the S&P 500 closed with a solid 1.30% gain. The beaten down Dow Transportation Average was up 1.40% as it moved back above its quarterly pivot which was violated last week. It was one of the sectors that gave a new sell signal last week.
Even more impressive was the importance of the energy stocks as the Philadelphia Oil Service Index was up 4.17% while the United States Oil ETF (USO) gained 4.49%. On Monday, Exxon Mobil Corp. (XOM) reported a 21% drop in earnings and announced they will be cutting share buybacks by $1 billion this year. Its stock closed up 2.47% on Monday.
Exxon Mobil, as well as other oil giants like ConocoPhillips (COP) and Occidental Petroleum Corp. (OXY) all have announced 15-20% cuts in new oil and gas projects this year. This suggests that they are not expecting a quick turnaround in crude oil prices.
In October’s This Market Could Hurt Stocks, I was concerned that lower crude oil prices could hurt the stock market. The very weak technical outlook for crude oil in early October did favor lower prices, but the plunge below multiple support levels was clearly a surprise.
On Monday, the open interest in crude oil dropped over 60,000 contracts and the money flow analysis turned positive on crude oil for the first time since last summer. Crude oil has a seasonal tendency to bottom in February so how high can crude oil go and what does that mean for the energy stocks?
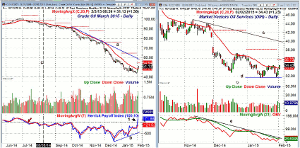
Chart Analysis: The daily chart of March Crude Oil shows the $6.22 cent rally since he doji low on January 29. A HCD buy signal was triggered on Friday.
The monthly projected pivot resistance is at $54.64.
- The daily downtrend, line a, is now in the $59 area.
- The 38.2% Fibonacci retracement resistance from the June high is at $65.28.
- The 20-day EMA is at $48.60 and is trying to turn up.
- The volume has picked up over the past three days and the OBV (not shown) has moved back above its WMA.
- The Herrick Payoff Index (HPI) uses volume, open interest, and price to measure money flow.
- The weekly HPI dropped below zero (line c) signaling negative money flow on August 8.
- The daily HPI had turned negative a month earlier (see arrow).
- The HPI formed positive divergences in mid-January, line b, and another last week.
- It has now moved above the zero line indicating positive money flow.
The Market Vectors Oil Service (OIH) was up 3.70% Monday and has bounced nicely from last week’s low at $31.63. It is still down over 22% in the past three months.
- The daily chart shows a potential double bottom formation, line d, at $31.63.
- The monthly projected pivot resistance is at $35.78.
- The December high is at $37.21 with the daily downtrend, line c, in the $39-$40 area.
- The daily on-balance volume (OBV) has just moved above its WMA.
- It is still below the daily downtrend, line e.
- The weekly OBV (not shown) closed below its WMA on September 12 and is still well below its WMA.
- The 20-day EMA is at $33.67 with further support at $32.50.
Next: Two More Energy Stocks to Watch
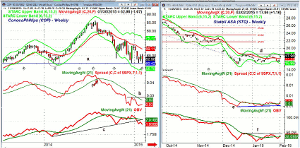
|pagebreak|ConocoPhillips (COP) had a low last week of $60.64 as it released earnings but closed the week at $62.98. Despite Monday’s 4.47% gain, it is still down 23.7% from its July high of $86.24.
- The low last week corresponds nicely to the February 2014 low of $60.42.
- This was followed by a high close doji buy signal the next week (see circle).
- The weekly relative performance dropped below its WMA (point 1) in early August.
- The RS line is still well below its WMA and needs to move above the resistance at line b, to complete a bottom.
- The OBV has been acting much stronger than prices as it just broke its uptrend, line c, last month.
- The daily OBV and RS analysis are both now slightly positive.
- The declining 20-week EMA at $69.11 with the late December high at $71.37.
Statoil ASA (STO) is a $7.3 billion international oil and gas company with operations in Norway, Europe, and North America. It has a yield of 8.92% and a current ratio of 1.27.
- They report earnings on Friday, February 6.
- The stock gapped 80 cents higher Monday and closed with a 6.90% gain.
- The daily chart has next resistance at $18.35.
- The daily chart shows a large gap in the $21.76 to $19.31 area.
- The 38.2% Fibonacci retracement resistance from the $31.25 high is at $21.70.
- The daily relative performance appears to have completed a short-term bottom formation, line e.
- The weekly RS line (not shown) is still well below its WMA.
- The daily OBV has moved back above its WMA but is still below the resistance at line f.
- There is short-term support now in the $16.93-$17.32 area.
What it Means: The open interest in the crude oil futures has rose sharply in January, which is in contrast to the declining open interest in the fall. As discussed previously, the rising open interest suggests the establishment of new short positions, which typically will eventually lead to a short squeeze. This now appears to be underway and crude could move to $54 or even the $58 area.
As I suspected a few weeks ago, it does now appear that very weak earnings have already been factored into many of the energy stock prices. They can continue higher, but Monday’s strength does not allow for any good risk/reward buying opportunities except for experienced short-term traders. Typically, it will take some time before a major low is in place and the weekly studies generate new buy signals.
How to Profit: No new recommendation.


