The home construction stocks had a dramatic turnaround in February, so MoneyShow’s Tom Aspray takes to the charts to see if any are likely to finally catch up and if the current correction offers some good buying opportunities.
The US market opened under pressure on Tuesday as most of the major averages were down around 0.5%. The exception was the Dow Jones Utilities that did manage to close 0.68% higher as the second recommended buy level for the Sector Select Utilities (XLU) was hit Monday.
The precious metals stocks were under pressure as the Market Vector Gold Miners (GDX) was down 1.83% and the iShares US Home Construction (ITB) lost 1.55% on the day. The decline in GDX is consistent with my view that the recent rally was just a pause in the major downtrend.
The short-term outlook for the stock market suggests the current correction can do a bit further with support for the Spyder Trust (SPY) in the $210 area along with the 20-day EMA. There is further support in the $208.50-$209 area. The S&P futures are again lower early Wednesday.
The strong market performance in February has changed the monthly and weekly technical outlook for several key industry groups. Therefore, the current correction may provide a good opportunity to buy some of the new market leading industry groups.
The home construction stocks had a dramatic turnaround in February, as at the end of January, I noted the negative technical readings as well as the failure of the group to widely outperform the overall market. If these stocks are going to finally catch up, the current correction should be a good buying opportunity.
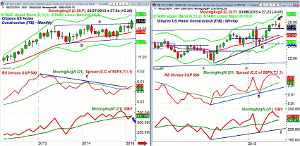
Chart Analysis: The iShares US Home Construction ETF (ITB) was up just 4.65% in 2014 but has already gained 5.22% in 2015.
- The monthly chart shows that the trading range, lines a and b, was completed in February.
- The range is just over $6 wide so the upside target is in the $32-$33 area.
- The quarterly projected pivot resistance is at $29.47.
- The monthly starc+ band is at $30.19.
- The monthly relative performance moved above its WMA in January.
- Now the downtrend, line c, has been broken.
- The monthly OBV reversed in February to close back above its WMA.
- A higher close in March is needed to confirm the positive signal.
- There is initial monthly support at $25 with the 20-month EMA at $23.89.
The weekly chart of iShares US Home Construction ETF (ITB) shows the weekly close on February 13 above the trading range.
- ITB formed a doji last week and a close on Friday below $27.78 will trigger a LCD sell signal.
- There is next good support in the $26-$26.50 area with the rising 20-week EMA at $25.84.
- The 20-day EMA at $27.11 was tested Tuesday.
- The sharp drop in January took the weekly RS line back below its WMA before it reversed to the upside.
- The RS line did make a new high last week.
- The weekly OBV also moved back above its WMA in February.
- The new OBV high confirmed the price action and the OBV is well above its rising WMA.
- There is initial weekly resistance at $27.90-$28.22.
Next: Another Homebuilder Stock to Watch
|pagebreak|Lennar Corp. (LEN) is a $10.1 billion homebuilder and provider of financial services. It is trading 4% below its 52-week high.
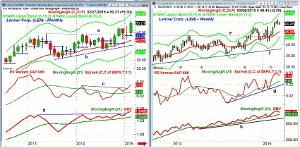
- LEN is up 10.44% YTD as it made a high last month of $51.51.
- This decisively completed the trading range, lines a and b.
- This was well above the January high at $48.47.
- The quarterly projected pivot resistance is at $53.92 with the starc+ band at $55.45.
- The upside target from the monthly trading range is at $56-$58.
- The monthly RS line moved above its WMA in October 2014.
- The key resistance at line c was overcome in February.
- The weekly on-balance volume has broken through resistance, line d, that goes back to 2013.
- There is monthly support at $47-$47.50.
The weekly chart of Lennar Corp. (LEN) also shows the formation of a doji last week and a close this week below $$49.26 will generate a low close doji sell signal.
- There is weekly support at $48 with the 38.2% Fibonacci retracement support at $47.47.
- The 50% retracement level is at $46.25 with the 20-week EMA at $45.89.
- The monthly projected pivot support is at $45.56.
- The weekly RS line moved out of its trading range in early February.
- The RS line is in a strong uptrend, line g, and is well above its WMA.
- The weekly on-balance volume (OBV) has made a new high with prices after testing its WMA in January.
- There is more important OBV support at line h.
What it Means: The requirement for positive signals from both the monthly and weekly RS/OBV analysis are part of the six-point checklist I suggested for 2015. The daily studies on both iShares US Home Construction ETF (ITB) and Lennar Corp. (LEN) are negative which does favor a further pullback. This should be a buying opportunity.
Many of the other homebuilders also look good, such as Meritage Homes Corporation (MTH) which has good support now in the $38-$40 area. Two others that also look good are: Toll Brothers (TOL) which has good support in the $35-$36 area and Ryland Group (RYL) which has support at $40-$41.
How to Profit: For iShares US Home Construction ETF (ITB) go 50% long at $26.56 and 50% long at $26.08 with a stop at $24.92 (risk of approx. 5.3%).
For Lennar Corp. (LEN) go 50% long at $47.52 and 50% long at $46.38 with a stop at $44.84 (risk of approx. 4.5%).


