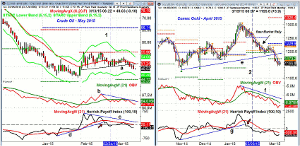
While the small-caps led the major averages higher on Thursday, on the downside were Crude Oil and Gold, so MoneyShow’s Tom Aspray examines the charts and money flow analysis to see if it’s likely that two commodities will face even more selling.
As I speculated in Thursday’s column, “The outperformance of the Transports could be an early sign that the correction is close to over.” While the market’s performance was impressive yesterday, it will require further gains to confirm that the market’s decline is over.
The A/D ratios were 3-1 positive on Thursday as the small-caps led the major averages higher with the Russell 2000 up 1.72% versus a 1.27% gain in the S&P 500 tracking Spyder Trust (SPY). Banks were even stronger as the KBW Bank Index gained an impressive 2.54%.
On the downside were the United States Oil ETF (USO) down 1.86% and the Market Vectors Gold Miners (GDX) which lost 0.71%. As I noted in last November’s Two Worst Markets in Any Time Frame, the longer-term technical outlook did favor lower prices
Crude oil prices had rebounded in February as the unique money flow analysis from the Herrick Payoff Index (HPI) turned positive on February 2. The HPI also signaled the rally in the precious metals in early 2015 but it had reversed to negative by early February.
So what do the charts and the important money flow analysis tell us now about these two markets?
Chart Analysis: The crude oil contract for May 2015 tested the quarterly pivot resistance at $55.96 (courtesy John Person’s software) several times in February but it was unable to break through it.
- Tuesday’s close below the support at line a, confirmed that the rebound in crude oil prices was over.
- The daily starc- band is at $46.46 with monthly projected pivot support at $44.73.
- The 127.2% Fibonacci target is at $42.54.
- The daily OBV turned negative on February 24 (line 1) as its WMA and support were broken.
- The OBV now shows a clear pattern of lower highs, line b.
- The Herrick Payoff Index (HPI) broke its uptrend on February 19, which was two days after the high at $56.08.
- Two days later, the HPI dropped below the zero line indicating that the money flow was now negative.
- The HPI did rally in early March but failed to move above its WMA and now shows a pattern of lower lows.
- The weekly HPI (not shown) is still well below the zero line and negative.
- The 20-day EMA is now at $51.22 with the monthly pivot at $52.22.
The April Comex gold contract has had a wide range, so far, in 2015 as after surging above $1300 for three days in January, prices have collapsed equally fast.
- As I pointed out last month (see chart), gold had just reached converging resistance on the weekly chart.
- The gold futures are still above the November 2014 low at $1132.10.
- The daily starc- band is at $1124 with the weekly band at $1108.
- The break of support at line e, completed the bear flag formation which has targets in the $1080-$1100 area.
- For the Spyder Gold Trust (GLD), the chart formation has downside targets in the $103-$105 area.
- The OBV on the futures formed a short-term negative divergence at the January highs, line f.
- It then dropped below its WMA on January 29, which was just five days after the high.
- The OBV is leading prices lower as it has already dropped below its November low.
- The break in the 2 ½ month uptrend in the HPI was followed on February 6 by the money flow turning negative (line 2).
- The weekly HPI turned negative two weeks ago.
- For April gold, there is first resistance now at $1174 and then $1190.
- For GLD, the initial resistance is at $113.26 and then $114.58.
What it Means: The very strong dollar has put additional pressure on these two weak markets. The crude oil contract could make further new lows as the $40 area could be tested or briefly broken. The energy stocks are acting more sold out and may hold above the early 2015 lows.
The gold futures are likely to endure further selling after the recent break of important support. The Market Vectors Gold Miners (GDX) also broke support and both the daily/weekly OBV analysis are negative. The next major downside targets are in the $13-$15 area.
How to Profit: No new recommendation.


