
Signs of increasing bearish sentiment are just what the market needs, says MoneyShow’s Tom Aspray, and he has found three stocks that had bullish reversals in Wednesday’s session.
Stocks closed mixed Wednesday as—while the Dow Transports were up 1.12%—the S&P 500 closed down 0.19%. Other bright spots were the small- and mid-cap stocks that were both up over 0.5% on the day. The outperformance of the Transports could be an early sign that the correction is close to over.
The market internals were stronger than prices as the A/D ratios were clearly positive. The decline since last Friday’s job report has clearly increased the bearish sentiment as—according to AAII—the bullish % has dropped to 31.60%, which is down 47.02% from just four weeks ago. This is the lowest reading since the market low on August 7, 2014.
An increase in the negative sentiment, as I pointed out last week (Calling All Bears), was needed to create the environment for a stronger stock market rally. A higher close today should set the stage for a further rebound but it will take several consecutive strong up days to indicate that the market’s correction is over.
As the market averages have declined, not all stocks have been weak on Wednesday. I focused on two leaders from IBD’s Top 50 list. In looking at yesterday’s action, three stocks stood out as they formed bullish reversals and look ready to move higher, so traders should consider new long positions.
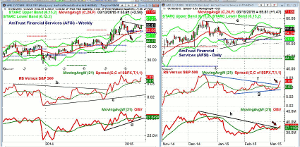
Click to Enlarge
Chart Analysis: AmTrust Financial Services (AFSI) is a $4.6 billion provider of specialty property and casualty insurance. It has a current yield of 1.52%.
- The weekly chart of AFSI reveals its flag formation.
- The breakout level from last October was tested in early January.
- The weekly starc+ band is at $61.27 with quarterly projected pivot resistance at $71.07.
- The weekly RS line broke out of its trading range, lines b and c, three weeks ahead of prices last October.
- This signaled that AFSI was becoming a market leader.
- The weekly on-balance volume (OBV) also broke out late last year.
- The OBV is now trying to turn up from its WMA.
- The monthly RS and OBV analysis are also both positive.
- The 20-week EMA, now at $52.06, held during January’s decline.
The daily chart of AmTrust Financial Services (AFSI) shows that the lower boundary of the flag formation was tested late last week.
- A daily close above $56.88 will complete the continuation pattern.
- The 127.2% Fibonacci target is at $61.73 with measured chart targets in the $67-$68 area.
- The daily relative performance has turned sharply higher in the past four days and moved through its downtrend, line f.
- This completed the flag formation in the RS, so prices should follow.
- The daily OBV has also just broken its downtrend, line h, which is positive.
- There is short-term support now in the $55 area with much stronger at $53.
- The daily starc- band is at $51.81 with the quarterly pivot at $51.03.
Next: Two More Stocks to Watch
|pagebreak|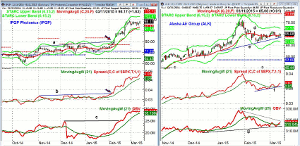
Click to Enlarge
IPG Photonics (IPGP) is a $5.2 billion dollar developer and manufacturer of high performance lasers used in material processing.
- IPGP was down -3.47% in 2014 but is already up 31.03% in 2015.
- IPGP broke through major resistance, line a, at the start of February.
- Prices have been in a tight range for the past two weeks but Wednesday’s close suggests an imminent breakout.
- The daily starc+ band is at $102.81 with the monthly projected pivot resistance at $115.21.
- The relative performance broke out its range in February as it moved through three month resistance, line b.
- The OBV did not move through the December highs, line c, in the middle of February.
- The weekly OBV is positive but has not yet moved to new highs.
- There is short-term support and the 20-day EMA at $93.36 with stronger at $88-$90.
Last week I focused on the three top airline picks of a momentum mutual fund but the recent action of Alaska Air Group (ALK) is positive.
- The support going back to early January, line e, has been tested over the past four days.
- There is next resistance at $66.22, line d, and a close above this level would be bullish.
- The daily starc+ band is at $67.53 with the monthly projected pivot resistance at $70.82.
- The daily RS line appears to have completed its bottom formation, line f.
- The weekly relative performance (not shown) is positive and above its WMA.
- The daily OBV has moved back above its WMA and now needs to overcome its downtrend.
- The 20-day EMA at $64.44 was overcome Wednesday with further support at $63-$63.40.
What it Means: In last Friday’s Week Ahead column, I shared my view that the current correction will ultimately be a buying opportunity. Other than looking to some of overseas ETFs, it does not warrant any change in your portfolio strategy at this time.
In a strong market, the technical setups for these three stocks would have a high level of confidence. In the current corrective market, new longs have a bit more risk as it seems too high in IPG Photonics (IPGP). Traders should look to buy with tight stops.
How to Profit: For AmTrust Financial Services (AFSI) go 50% long at $55.37 and 50% long at $54.28 with a stop at $52.88 (risk of approx. 3.5%). On a move above $59, raise the stop to $53.90.
For Alaska Air Group (ALK) go 50% long at $64.96 or better and 50% long at $64.29 with a stop at $61.88 (risk of approx. 4.2%). On a close above $67, raise the stop to $62.88.


