
The airlines were one of the best performing industry groups in 2014 and three of the airline stocks are favored by the Leuthold Group, so MoneyShow's Tom Aspray takes a technical look to see if any of its favorites appear ready for purchase.
The sharp market decline last Friday pushed stocks in Asia lower with India’s S&P BSE Sensex Index down over 2% while Japan’s Nikkei 225 lost less than 1%. Euro stocks are mixed in early trading, which is an encouraging sign.
The S&P futures are up slightly in early trading as the support in the 2065 area has been tested. With Friday’s close, the McClellan oscillator has dropped to -250, which is quite close to the 2014 low of -272. In June of 2013 it did go even lower as it dropped to -329. Though the market is getting oversold, there are no signs yet of a bottom from the short-term technical studies.
In the past month, one of the top performing industry groups has been the Dow Jones US Travel & Tourism Index as it is up 13.8%.This index includes the rental car companies as well as Expedia (EXPE) and Priceline Group (PCLN). Many are wondering if consumers will be taking more vacations this year as the lower gas prices are leaving them with more disposable income.
The airlines were one of the best performing industry groups in 2014 and three of the airline stocks are favored by the Leuthold Group. Their flagship fund, the Leuthold Core Investment (LCORX) follows a somewhat unique industry rotation strategy that was discussed over the weekend in Barron’s (Momentum Riders).
This fund has lagged the S&P over the past five years as it was up 8.58% in 2014 versus a 13.46% gain in the Spyder Trust (SPY) During the 2000-2002 bear market, which I discussed last week in Avoiding Bear Markets, they managed a positive return while the S&P 500 was down about 50%.
Currently the Leuthold Core Investment (LCORX) has 10% in the airlines as it is their largest industry group holding, let’s look at the charts of their three favorite picks.
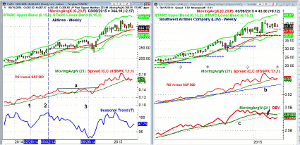
Click to Enlarge
Chart Analysis: The Airlines Index peaked at the end of January before it turned lower. It had rallied sharply from the dramatic lows in mid-October.
- The index is down 2.90% so far in 2015 but was up 88% in 2014.
- The flat 20-week EMA and the monthly projected pivot support are in the 333-335 area.
- This is just 3% below Friday’s close.
- The relative performance broke out to the upside at the end of October as resistance at line a, was overcome.
- The seasonal pattern for the airlines indicates that it typically forms an interim low on February 26 (line 1).
- This is followed by a rally until May 2 (line 2) with the primary yearly low on September 26 (line 3).
- A weekly close above the high at 367.20 should signal that the correction is over.
Southwest Airlines Company (LUV) is one of the favored airlines as it was up 125.80% in 2014. It is up just over 2% so far in 2015.
- The monthly pivot support is at $41.73 with the rising 20-week EMA at $40.69.
- The quarterly pivot is at $37.90 with the weekly starc- band at $38.01.
- The weekly relative performance is trying to turn up from its rising WMA.
- The RS line has much stronger support at line b.
- The weekly OBV did not make a new high with prices in January.
- The support in the OBV, line c, was broken the week of February 6.
- The OBV is still below its declining WMA and the daily OBV (not shown) is still negative.
- There is initial resistance now at $45.43.
Next: Two More Airline Stocks to Watch
|pagebreak|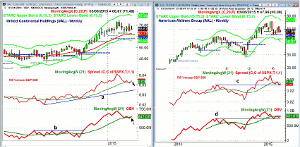
Click to Enlarge
United Continental Holdings (UAL) was higher last week despite the overall market weakness. It was up 76.82% in 2014 but is down 2.56% so far this year.
- The still rising 20-week EMA is at $62.71, which is 6% below Friday’s close.
- The monthly projected pivot support for March is a bit lower at $61.88.
- The weekly RS line moved back above its WMA last week.
- There is longer-term support at line a.
- The weekly OBV closed back above its WMA last week suggesting the correction may be over.
- Therefore, Aspray’s OBV Trigger (AOT) has triggered a positive signal.
- A higher close is needed this week to confirm.
- The monthly studies are both positive but the daily indicators are negative.
- There is initial resistance now at $71.38 and a close above this level would be bullish.
American Airlines Group (AAL) spiked to a high two weeks ago of $52.20 but closed Friday below $48.
- AAL was up 113.19% in 2014 but is down 10.50% so far in 2015.
- There is next support at $46.50 with the quarterly pivot and starc- band in the $45.34 area..
- The relative performance has dropped back to support at line c.
- The weekly RS line is below its WMA but tried to turn higher last week.
- The weekly OBV broke through resistance at the end of October (line d) but has now dropped back to test this support.
- The daily OBV is now positive while the RS line is trying to bottom out.
- The 20-day EMA is now at $49.16 with the February high at $52.20.
What it Means: The monthly RS and OBV analysis is positive on all three of these airlines. The weekly OBV on Southwest Airlines Company (LUV) looks the weakest of the three and suggests its correction is not yet over. American Airlines Group (AAL) also still looks vulnerable to a further pullback.
United Continental Holdings (UAL) does look the best technically as the weekly studies flipped back to positive last week. Therefore, a bit more of a pullback should be a buying opportunity.
How to Profit: For United Continental Holdings (UAL) go 50% long at $65.48 and 50% long at $64.72 with a stop at $61.59 (risk of approx. 5.4%).


