
Though the major averages are still locked in short-term and intermediate-term trading ranges, many sectors—including healthcare—have traced out more typical corrective patterns, so MoneyShow’s Tom Aspray takes to the charts to see if there are technical signs that the correction in healthcare is over.
The stock market rallied in reaction to the FOMC minutes as all of the major averages except the Dow Utilities closed higher for the day. Still, most did close below the day’s highs, but the market internals were positive. The NYSE Advance/Decline line closed the day at another new all time high.
The sharp drop in crude oil prices hit the energy stocks hard as the SPDR S&P Oil & Gas Exploration (XOP) was down 2.92%, while the Sector Select Energy (XLE) held up better, down just 0.81% on the day. Alcoa, Inc. (AA) surprised many after the close as its earnings were better than expected.
Though the major averages are still locked in both short-term and intermediate-term trading ranges, many of the sectors have traced out more typical corrective patterns. For example, the Sector Select Health Care (XLV) from the March 20 high to the April 1 low lost 6.17%.
As I discussed Monday, XLV did close last Friday slightly below its quarterly pivot at $72.05. But it has rebounded nicely this week, so are there any technical signs that the correction in XLV is over? What about some my recent healthcare picks?
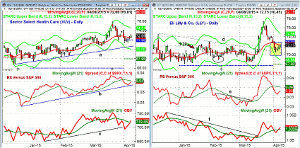
Click to Enlarge
Chart Analysis: The Sector Select Health Care (XLV) peaked in March at $76.01 and then dropped slightly below the 50% retracement support at $71.36.
- The daily uptrend, line a, is now at $70.60 with the 61.8% Fibonacci support at $70.27.
- The monthly pivot support is at $70.17 with the daily starc- band at $70.
- The daily RS line has turned up from support at line b, but is still above its WMA.
- The weekly relative performance (not shown) is still above its WMA.
- The daily OBV briefly broke its WMA before reversing to close above its WMA Wednesday.
- A close back above the recent swing high at $74.17 would be another sign that the correction is over.
- The daily starc+ band is at $74.51 with monthly pivot resistance at $78.34.
- A Friday close above $72.05 would reverse last week’s signal.
Eli Lilly & Co. (LLY) was recommended on January 20 and the final buy level was hit in early February (see circle).
- The daily downtrend, line d, was finally overcome in the middle of March.
- The sharp rally hit the daily and also the weekly starc+ band before it reversed.
- The breakout level was retested last week (see highlighted section) as the pullback was very sharp.
- LLY is still below the quarterly pivot at $72.69 with further resistance now in the $74-$74.50 area.
- The daily RS line completed its short-term bottom in early March as it overcame resistance at line e.
- The RS line has turned up but is still below its WMA.
- The daily on-balance volume (OBV) confirmed the price action by breaking its four month downtrend, line f.
- The OBV appears to have completed its correction as it has moved back above its WMA.
- The 20-week EMA is at $70.24.
Next: Two More Recent Healthcare Picks to Watch
|pagebreak|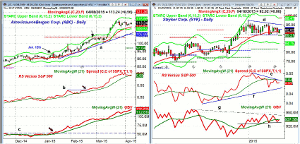
Click to Enlarge
AmerisourceBergen (ABC) was recommended on January 12 and the buy levels were hit the same day.
- The new uptrend was confirmed later in January as ABC surged to the $100 level.
- ABC hit the quarterly pivot resistance at $104.15 in late February.
- On the latest surge, ABC hit a high of $114.73 with the daily starc+ band now at $115.99.
- The monthly projected pivot resistance is at $122.86.
- The RS line broke out in late January and then moved through resistance, line b, again in February.
- The OBV broke through long-term resistance, line c, in early January.
- The OBV has continued to make higher highs as it did Wednesday.
- There is initial support at $110.83 and the rising 20-day WMA.
- There is further support in the $109-$109.53 area.
Stryker Corp. (SYK) is a $35.8 billion medical technology company that has stayed in its weekly trading range since it was recommended in February.
- There is near-term resistance now in the $94 area which needs to be overcome to signal a potential upside breakout.
- There is more important resistance at $95.82 with the weekly starc+ band at $98.47.
- The weekly RS line is still in a longer-term uptrend, line f.
- It needs to move through its downtrend, line e, to signal that SYK is turning into a market leader.
- The weekly OBV has stayed below its downtrend, line g, for the past two months.
- A close above this level could precede an upside breakout in prices.
- There is good OBV support at line h.
- The recent low is at $89.47 with the quarterly pivot support at $89.21.
What it Means: Until the Sector Select Health Care (XLV) closes above the $74.17, I cannot rule out one more drop and a potential new correction low before the bottom in XLV is complete.
The setback in Eli Lilly & Co (LLY) was certainly sharper than expected and I regret not taking partial profits. I am now looking for another entry point.
I did take partial profits in AmerisourceBergen Corp. (ABC) and Actavis, Inc. (ACT).
As noted below, two other healthcare picks haven’t yet completed their corrections.
How to Profit: For Eli Lilly & Co (LLY) was 50% long at $70.68 or better and 50% at $69.77, which were stopped out at $70.77. Would go 50% long at $71.42 and 50% long at $70.66 with a stop at $67.44.
Portfolio Update: For AmerisourceBergen Corp. (ABC) went 50% long at $92.44 and 50% at $91.24. Sold 50% at 103.67 or better. Raise the stop now to $104.93, and on a move above $115, raise it further to $109.44. For St. Jude Medical (STJ) should be 50% long at $66.72 and 50% at $65.78 with a stop at $63.19
For Stryker Corp. (SYK) should be 50% long at $93.88 and 50% at $92.76 with a stop at $89.07. On a move above $96, raise the stop to $90.74.
For DENTSPLY International (XRAY), hasn’t completed its corrective pattern yet. There is key resistance now at $54. Should be 50% long at $51.32 and 50% at $50.46 with a stop at $49.22.
For Actavis, Inc. (ACT) went 50% long at $268.34 and 50% at $263.04, sold half at $298.30 or better. Raise the stop to $283.44.


