Healthcare was one of the few market sectors to close the week higher, so MoneyShow’s Tom Aspray takes to the charts to see if three of the market leaders in the sector technically still look strong and ready to rise further.
The strong rally late Friday encouraged the stock market bulls as many of the daily technical studies turned higher. The major averages were able to close above their quarterly pivot levels so avoided weekly sell signals from the pivot analysis. Still, the daily technical studies need further strength before they could turn positive.
The strength on Friday was also enough to move the Two Sectors on the Edge back above their quarterly pivots by the week’s close. The Select Sector Financial (XLF) did close the week below its quarterly pivot. It was the only of the key sector ETFs to generate a new signal last week.
The 7.7% drop in the Shanghai Composite was in reaction to a crackdown on margin lending which has surged along with its stock market over the past year. It was the largest drop in six years but in Monday trading, the EuroZone markets were apparently not worried as they closed higher. They have continued higher in early trading Tuesday.
Last week, the utilities again led the market higher gaining 2.62%, but healthcare was one of the few market sectors to also close the week higher. In my weekend scan, there were three healthcare stocks that have very bullish monthly/weekly volume analysis confirming them as market leaders.
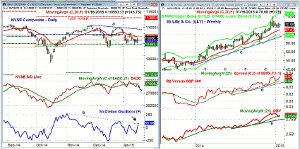
Chart Analysis: The NYSE Composite closed last Friday just slightly above the prior two day highs and the quarterly pivot at 10,597.
- The still declining 20-day EMA is at 10,705 with the last swing high at 10,811.
- The daily downtrend, line a, is in the 10,950 area.
- A completion of the recent trading range has a 127.2% Fibonacci target at 11,279.
- This is just slightly below the quarterly projected pivot resistance at 11,309.
- On Friday, the advancing stocks led the decliners by a 4.4 to 1.0 margin.
- The NYSE Advance/Decline Line closed just slightly above its WMA on Friday.
- The McClellan oscillator rose sharply on Friday to +88.98 as the downtrend, line b, was broken.
- A rise in the oscillator above the late December high at +117 will confirm the breakout.
- The low last week was at 10,442 with the December low at 10,360.
Eli Lilly & Co (LLY) is a $78.7 billion drug manufacturer with a current yield of 2.77%. LLY peaked at $75.10 on December 11 and closed Friday 5.8% below its high. The stock has a yield of 2.90%.
- The weekly chart shows that LLY spiked above its weekly starc+ band in December.
- The ranges over the past three weeks have been narrow as two dojis have been formed.
- A close this week above $71.49 would trigger a high close doji buy signal.
- The quarterly pivot is at $68.08 with the 20-week EMA at $67.47.
- The weekly relative performance has turned up in January as LLY is up 2.4%.
- The monthly RS line (not shown) is now at new highs.
- The weekly OBV turned up last week after testing its WMA. It is well above the support at line e.
- The monthly OBV made a new high in December.
- The weekly starc+ band is at $76.63 with the quarterly projected pivot resistance at $83.04.
Next: Two More Healthcare Stocks to Watch
|pagebreak|Hospira Inc. (HSP) is a $10.7 billion provider of injectable drugs and other infusion products. They report earnings on February 12.
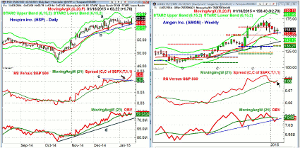
- The daily chart shows what appears to be a continuation pattern going back to November, lines a and b.
- The monthly projected pivot resistance is at $65.70 with upside targets from the daily chart in the $70-$71 area.
- The quarterly projected pivot resistance is at $73.86.
- The daily RS line has already broken out to the upside as resistance (line c) has been overcome.
- The weekly/monthly relative performance has made new highs and both are well above their WMAs.
- The daily on-balance volume (OBV) is still in a tight range and just slightly above its WMA.
- The weekly/monthly OBV (not shown) are both clearly positive.
- The close last week was above the prior week’s doji high of $62.37 with the monthly pivot at $61.13.
Amgen Inc. (AMGN) has a market cap of $120.51 billion and they report earnings on January 27. The stock was up 4.29% on Friday.
- The quarterly pivot at $153.20 was violated last week before the strong close at $158.43.
- AMGN peaked at $173.14 on December 8 and closed last Friday 8.5% below the high.
- The pullback on the weekly chart looks like a normal correction as the 20-week EMA has been tested.
- The 38.2% Fibonacci was violated but the 50% support at $150.09 has held.
- The weekly RS line closed last week back above its WMA, which is a positive sign.
- The multiple time frame relative performance is positive.
- The weekly OBV has risen back above its WMA but is just barely below its WMA.
- The monthly OBV did confirm the highs and is well above its WMA.
- There is minor support now in the $155.50-$157 area.
What it Means: In early trading Tuesday, the S&P futures are up 16 points but it will be the daily close that is the most important.
The healthcare sector has been a favorite since 2012 when it broke out of twelve year trading range. It technically still looks strong even though many do question how long this rally can last.
All three of these healthcare picks technically have completed their correction and are ready to move higher. Each of these stocks does satisfy the Six-Point Checklist for a Profitable 2015 and the risk of buying in the recommended zones is favorable.
How to Profit: For Eli Lilly & Co (LLY) go 50% long at $70.68 or better and 50% at $69.77 stop at $66.83 (risk of approx. 4.8%).
For Hospira Inc. (HSP) go 50% long at $63.22 or better and 50% at $62.42 stop at $59.77 (risk of approx. 4.9%).
For Amgen Inc. (AMGN) go 50% long at $156.34 or better and 50% at $153.66 stop at $149.17 (risk of approx. 3.9%). Cancel if $162 is hit first.
Portfolio Update: As I noted in last Friday’s Week Ahead column I recommended that traders buy the Spyder Trust (SPY) at $200.80 or better. It trades as low as $200.32 in the hour after the Tweet was sent.
As I recommended in the Tweet, would add 50% at $200.20 or better and use a recommended stop at $196.57.


