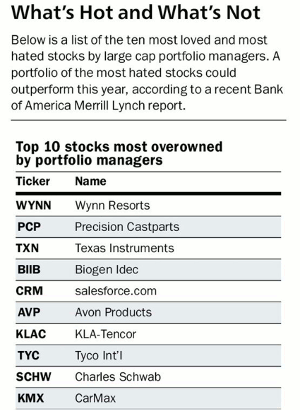
A recent report found that stocks that had the lowest ownership by portfolio managers did better than those that were most owned, so MoneyShow’s Tom Aspray takes a technical look at three of these stocks to see if any look likely to continue to lag the S&P 500.
After Friday’s broad based selling, the Euro markets are higher in early trading as are the futures. Of course, it will be the close that is most important, and as I detailed in Friday’s Weak Ahead column, there is compelling evidence that this is just a pullback not the start of a more significant correction. This week’s price action will further clarify the outlook.
In this week’s Barron’s Trader Column, they quoted “a recent report from Savita Subramanian, Bank of America Merrill Lynch’s equity and quantitative strategist.”
In the study, she compares the performance of those stocks that were “most overowned” (see list above) with those that were “most underowned.” The report found that those stocks that had the lowest ownership by portfolio managers did much better than the market or those that were most owned.
Three of the stocks on the most owned list have a technical outlook that suggests they will continue to lag the S&P 500 and investors should now take note.
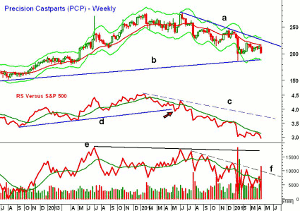
Chart Analysis: Precision Castparts (PCP) has a market cap of $28.5 billion and dropped 1.76% on Friday. PCP manufactures complex metal components for a wide range of industrial companies.
- PCP is down 16.48% YTD and last week’s close was the lowest of the past nine weeks.
- The stock broke important support last July when it closed at $230.
- The long-term support was tested in January as the stock hit a low of $186.14.
- The monthly pivot support has already been violated, with the weekly starc- band now at $188.14.
- The weekly relative performance violated its long-term support, line d, three weeks before the final high in June.
- The RS line has continued to make lower lows and stayed below its declining WMA.
- The volume picked up last summer and the OBV had already formed a negative divergence, line e.
- The OBV has stayed in a downtrend since last summer.
- There is initial resistance now in the $210 area with further at $216.
Next Page: Two More Overowned Stocks
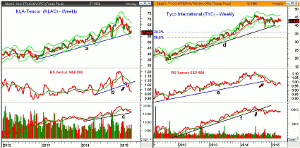
|pagebreak|KLA-Tencor (KLAC) is a $9.4 billion dollar semiconductor equipment and materials company with a current yield of 3.40%.
- KLAC closed last week on the long-term uptrend, line a.
- The quarterly pivot support is at $53.62 with the weekly starc- band at $52.67.
- The RS line did make a new high with prices at the end of 2014.
- The support in the RS, line b, was broken at the end of February, which was a sign of weakness.
- The RS line has already dropped below the October lows.
- The OBV dropped below its WMA at the end of January.
- The failure of the OBV to move above its WMA in February was negative.
- The 20-day EMA is at $59.48 with the quarterly pivot at $62.16.
- The monthly pivot resistance is at $63.86.
Tyco International (TYC) has a market cap of $17.8 billion as they are a provider of fire detection and suppression services with a yield of 1.7%. It is down 2.85% YTD.
- The stock was down 2% on Friday but closed just above the quarterly pivot at $42.33.
- The monthly pivot support is at $41.67 with the recent weekly low at $41.47.
- The long-term uptrend, line d, is now at $41.27 while the weekly starc- band at $39.82.
- The relative performance topped out in August and it broke key support, line e, in November.
- The RS line has rallied back above its declining WMA twice over the past six months but has continued to make lower lows.
- The weekly OBV dropped below support, line f, in July 2014.
- The OBV has been flat so far in 2015, but is now below its WMA.
- TYC opened last Friday below the 20-day EMA at $43.03 with further resistance at $43.50-70.
What it Means: It will be interesting to watch these three stocks as both KLAC and TYC report earnings this week. The negative weekly charts suggests an earning’s miss may not easily be forgiven. PCP does not report until May 13 but it has the weakest chart right now.
Two stocks on the list—Avon Products (AVP) and CarMax Inc. (KMX)—do have more positive charts as KMX has been a market leader since last fall.
How to Profit: No new recommendation.


