
Since the technology stocks led the market higher last week, MoneyShow’s Tom Aspray takes to the charts to determine what the technical studies are currently saying about the tech sector and one stock as we head into the summer months.
The technology stocks led the market higher last week even though most of the major averages sagged into the close last Friday. The S&P futures showed a loss of short-term momentum in weekend trading and have declined further early Tuesday. The EuroZone markets are also lower in early trading with the Dax showing a 0.70% loss.
As I noted in Friday’s Week Ahead column, the S&P 500 and S&P 1500 Advance/Decline lines both made new highs on Monday, May 18, before turning lower late in the week. The A/D lines have been acting stronger than prices and this is a bullish sign for the markets.
Apple, Inc. (AAPL) stock surged to a new high in late April, confirming the positive signs from the technical studies Time to Buy Apple Again? The stock quickly reversed to the downside as it dropped down to good support before last week’s 2.9% gain.
So, what do the technical studies say about the tech sector and Apple stock as we head into the summer months?
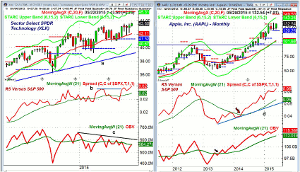
Click to Enlarge
Chart Analysis: The Sector Select Technology (XLK) closed at new five week highs last week but the ranges were tight.
- The weekly chart shows next major resistance in the $45.31 area, which corresponds to weekly starc+ band and the quarterly pivot resistance.
- The weekly relative performance closed at a new high last week, consistent with a market leader.
- The weekly RS line is well above its rising WMA.
- The daily RS line (not shown) has broken out of its recent trading range.
- The OBV is still lagging the price action as it has just rallied back to its WMA.
- On a short-term basis, a pullback to the 20-day EMA at $43.05 would not be surprising.
- The daily starc- band is at $42.58.
Though the month is not over yet, the monthly chart of Apple, Inc. (AAPL) is so far showing a nice monthly gain after the doji in April.
- Once above the doji high at $132.97, the monthly starc+ band is at $143.25.
- The quarterly projected pivot resistance is at $149.50.
- The lows of the past two months held well above the quarterly pivot at $120.25.
- The monthly RS line looks ready to close the month at a new high as it moved above its WMA in April 2014.
- The monthly on-balance-volume (OBV) also is making a new high this month.
- The 20-month EMA is at $103.02.
Next Page: Another Daily and Monthly Apple Chart to Watch
|pagebreak|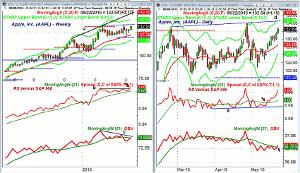
Click to Enlarge
The weekly chart of Apple, Inc. (AAPL) shows the recent thirteen week trading range. AAPL is up 20.97% YTD.
- The early May high slightly exceeded the February high.
- The weekly starc+ band is now at $140.05.
- The weekly range is almost $13 wide so a breakout would have upside targets in the $145-$148 area.
- The weekly RS line made a new high last week, consistent with a market leading stock.
- The weekly OBV has turned up over the past three months but is still barely below its WMA.
- A move in the OBV above the downtrend, line c, would be bullish.
- There is initial weekly support now at $128.36 with the rising 20-week EMA at $123.28.
The daily chart of AAPL more clearly shows the recent volatility, with resistance and the daily starc+ band at $134.66.
- The daily RS line moved back above its WMA on May 14, signaling the recent rally.
- The RS line is now close to the April high.
- There is strong relative performance support now at line e.
- The daily OBV did make a new high with prices in April before dropping sharply.
- The OBV just moved above its WMA on Friday.
- There is initial support at $129.50-$130.
- AAPL is currently 3% above its rising 20-day EMA at $128.58.
- For June, the monthly pivot support is at $127.07.
What it Means: Apple, Inc. (AAPL) is an 18% holding in the Sector Select Technology (XLK) so this is also a way to participate in a upside breakout by AAPL. A tight stop for XLK would be under $42 and a wider stop under the quarterly pivot at $41.32.
As per our recommendation in January, investors are long from much lower levels. In April, we also recommended that traders buy AAPL and the second buy level was hit in late April and early May.
How to Profit: No new recommendation.
Portfolio Update: Should be 50% Apple, Inc. (AAPL) at $110.72 or better.
Raise the stop now to $121.77.
Traders are 50% long Apple, Inc. (AAPL) at $127.54 or better and 50% long at $125.12. Use a stop now at $124.47. Sell ½ the position at $143.20 or better, and if filled, raise the stop on the remaining position to $131.33.


