
Heiken Ashi, a two-decade-old analysis method, is gaining in popularity for its merits as a reliable indicator of overall market trends. See real market examples of how to use Heiken Ashi to trade forex.
Investors and speculators are always looking for an edge in determining the strength and direction of trends, and the Heikin Ashi application is one tool that may be able to provide this edge. Similar to Ichimoku charts, the Heikin Ashi has been a relatively unknown tool that has recently seen a rise in popularity, even though it has been accessible since its introduction almost two decades ago.
In addition to showing the relative strength of a trend, the application also notes key turning points in price action and reacts much like a moving average. Incorporating the overall session activity in a single candlestick (open, close, high, and low), the charting tool also "smoothes over” erratic fluctuations in the currency markets and omits spikes that may be caused by volatility or jumps in price.
This allows chartists to obtain a clearer picture of what’s going on in the market and make more informed trading decisions. Let’s take a look at how the Heikin Ashi is calculated and how it can be applied to forex trading.
Defining the Heikin Ashi
Before we get into the actual application of the Heikin Ashi, let’s dive into some logistics involving the real meaning behind it. Usually a type of candlestick chart, the Heikin Ashi is available on some charting packages as a separate indicator. This allows investors or speculators to make a side-by-side comparison between the standard candlestick and the Heikin Ashi, allowing for a more cohesive interpretation.
In Figure 1, the chartist can see that the two are very similar but offer different perspectives, as the Heikin Ashi indicator disregards market noise and concentrates on the smoother trend of the underlying price action in the euro/US dollar (EUR/USD) currency pair.
Below we see a nearly identical interpretation (Top: price action; Bottom: Heikin Ashi):

Click to Enlarge
The reason the Heikin Ashi tends to be smoother is because instead of using a simple low and high of the session to calculate individual candles, the Heikin Ashi takes the prices per bar and averages them to create a "smoother" session.
This is key because the currency markets tend to offer traders more volatility and market noise in the price than other markets. Here is how each candle is constructed:
- Close = (Open price + high + low + close) / 4
- Open = (Open price of the previous bar + close price of the previous bar) / 2
- High = [Maximum value of the (high, open, close)]
- Low = [Minimum value of the (low, open, close)]
By plugging formulas into each individual session to construct consecutive candles, the chart continues to be reflective of the underlying price action, isolating the price and excluding currency market volatility and noise. The resulting picture gives the trader a more visually appealing perspective, and one that can help in identifying the overall trend.
NEXT: How to Interpret Heiken Ashi Candles
|pagebreak|Now that we’ve established how the candles are calculated, here is how to interpret them:
- Positive candles (blue) containing no wicks: There is strong uptrend momentum in the session and it will likely continue. Here, the trader will have a hands-off approach to profits while strongly considering adding onto the position
- Positive candles (blue) containing shadows or wicks: Strength continues to support the price action higher. At this point, with upside potential still present, the investor will likely consider the notion of adding to the overall position
- A smaller candle body with longer wicks: Similar to the doji candlestick formation, this candle suggests a near-term turnaround in the overall trend. Signaling indecision, market participants are likely to wait for further directional bias before pushing the market one way or the other. Traders following on the signal will likely prefer confirmation before initiating any positions
- Negative candles (red) containing shadows or wicks: Weakness or negative momentum is supporting the price action lower in the market. As a result, traders will want to begin exiting initial long positions or selling positions at this point
- Negative candles (red) containing no shadows or wicks: Selling momentum is strong and will likely support a move lower in the overall decline. As a result, the trader would do well to add to existing short holdings.
The Heikin Ashi will still take some time to master, however, once this is accomplished, it will act to confirm the overall trend of the price action. Now let’s see how it is used in market opportunities.
NEXT: Using Heiken Ashi to Derive Valuable Market Signals
|pagebreak|Improve on Trading Opportunities
With a smoother picture, and sometimes a more simplified one, a speculator can improve upon trading the overall trend by combining the Heikin Ashi with multiple indicators. As with any other chart application, it’s better to find an indicator that works well with your individual trading style when adding on the Heikin Ashi application.
This will not only help traders to establish a directional bias, but it will also clear up entries, support and resistance, and offer further confirmation of the trade becoming profitable.
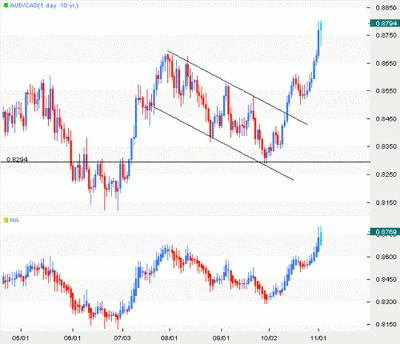
In Figure 2, the chartist is looking at a prime example using the Australian dollar/Canadian dollar (AUD/CAD) currency pair.
Click to Enlarge
Taking a look at the price action, the Australian dollar weakened enormously against a rising Canadian dollar, hence the downtrending channel. Reaching the psychological 0.8300 support, the cross pair presents an opportunity to the speculator.
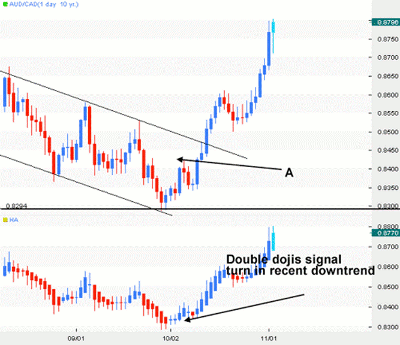
Not only is the AUD/CAD pair testing the support trend line at the 0.8300 level, the potential bottom coincides with the lower channel trend line. Confirming the strength of such a barrier, we overlay the Heikin Ashi and focus on the two dojis that have formed on the chart. The presented signal gives us the best confirmation in this example, as the trade is calling out a long position in Figure 3.
Click to Enlarge
Signaling a potential turn in the price action, the dojis set the trade up nicely. Next, an entry point must be established. At this point, the best entry afforded, according to industry theory, is a break above the high of the session at point A in Figure 3.
This will set the long buy order at 0.8400 with a corresponding stop two points, for example, below the low of the session, at 0.8328. Theoretically, the trade is looking to profit not only on a retracement test of the upper trend line, but also a potential break. That’s where the profits lie, as the break above would create a longer-term advance.
The idea coincides with what is being viewed on the Heikin Ashi. Over the course of the next month, with the stop fully intact and untriggered as the price never trades back, the long position remains profitable until the creation of another doji near mid-month.
Taking into account the close of the session—including the doji, which is precisely set at 0.8554—the trade has already profited by 154 points. Looking back, this is more than sufficient, as the risk/reward ratio is well above the 2:1 minimum prescribed. Subsequently, a trailing stop would be perfect for keeping profits close while letting the trade’s potential unfold in the coming weeks.
See video: Make Sure Risk/Reward Is on Your Side
NEXT: Another Textbook Trading Example
|pagebreak|Breaking It Down
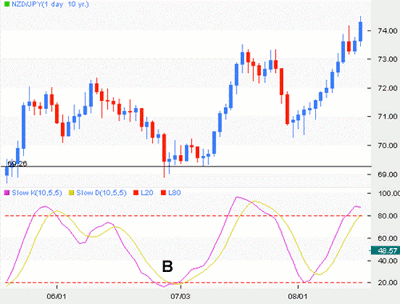
Let’s take it down a notch and look at the steps of another example. Here, we’ll reference a textbook example in the New Zealand dollar/Japanese yen (NZD/JPY) currency pair.
Taking a look at the overall price action, we see consolidation in the month of July on the longer-term daily chart. Applying the stochastic oscillator, we see a “golden cross” form (point B), suggesting a near-term uptick in the chart below.
Click to Enlarge
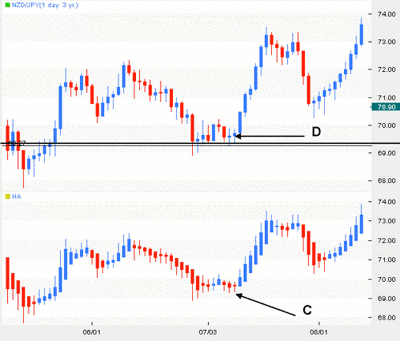
- Identify support or resistance: Although not a full requirement, this helps to establish a viewpoint where a directional bias can be established. This will likely help in isolating points of entry, assisting with stop placement and risk assessment. In the example, there is ample support that is coming in at the 69.25 figure, offering a great opportunity for a long trade.
- Overlay the technical indicator: The stochastic oscillator assists in suggesting bidding support as both indicators begin to form a golden cross. The cross at point B confirms the trade bias and isolates the point of entry.
- Confirm with Heikin Ashi: Obtaining the entry point off of support and the technically bullish crossover in the stochastic, the trader can confirm the strength of the nascent trend by using the smoother-based candles. In the visual example at point C, the chartist can see that the doji is indicative of the shift in momentum as sellers begin to exit the market. Simultaneously, the following longer-bodied candle signifies a stronger uptrend in buying
- Place Entry Order: Now, with the directional bias confirmed, the trader will do well to place the entry five to ten points above the doji session high. Although the order can actually be placed at the high or any other position in the session, the placement in this case is in order to capitalize on a breakout of price action (point D). As a result, the entry is placed at 69.90.
Placing the corresponding stop five points below the support will ensure a viable test. Should the level be broken to the downside, the previous trade is negated on overriding selling momentum. However, in this case, our indicators confirmed the directional bias, profiting 360 points before topping out for the first time two weeks.
Click to Enlarge
As you can see, although still somewhat new to the currency market analyst, chartist, or trader/speculator, the Heikin Ashi is a viable tool that can help to confirm the momentum of a trend.
Additionally, similar to the moving average, the smooth calculation helps in isolating market opportunities by removing the noise that will almost always lead a trader astray and clog up the technical perspective.
As a result, by using this application and keeping in mind its longer-term uses and advantages, any participant in the currency market can apply and reap the benefits of such a simple tool while keeping a finger on the detailed pulse of the market.
By Richard Lee, contributor, Investopedia.com
Richard Lee is currently a contributing analyst for ForexAlliance and BinaryMagnates.com


