The trend is your friend is a popular trading expression, but often newbie traders repeat this word for word, yet they are still having trouble with making money in their trades, notes Rick Wright of Online Trading Academy.
One thing that I try to emphasize in the classes that I teach is the fact that the “bigger picture” trend is just as important as the zones we are defining. Trading with the trend makes trading easier, and I would guess more profitable. So how to define the trend?
First of all, we must define the trend we wish to trade with. My general recommendation to new students is to use a larger time frame like a weekly, daily, or four-hour chart, then a smaller time frame to “time” your entry in the larger time frame trend to join the bigger picture traders. The reasoning is simple—bigger time frames usually mean bigger money traders are using it. Large institutions are often trading forex to hedge currency risk, which must be managed over weeks and months at a time. Do you really believe that a large multi-billion dollar, multi-national corporation is trading from a two minute chart trying to squeeze out eight pips over the next ten minutes? I doubt it!
Trading with bigger time frames can help us ignore the “noise” that is associated with these small time frames. My definition of a downtrend is a series of lower highs, and I’d like to see lower lows. My definition of an uptrend is higher lows, and I’d like to see higher highs. There are two reasons for this slightly odd pair of definitions: one, is that in an uptrend, the lows are more important, showing us where the bigger traders are buying more aggressively (and the highs in a downtrend offer the same information, except selling this time.) The second reason for this odd definition is to help me time entries using candlesticks in my previously mentioned zones. You’ll have to come to class to see that in action!
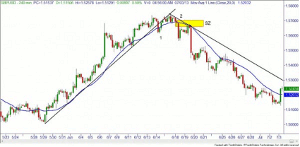
There are three basic techniques that people use to define their trends: pure price action, trendlines, and also moving averages. To save space all three are represented on this chart. Interestingly, at point labeled 1, both the price action technique and the primary trendline show a break of the longer-term trend, while the moving average didn’t change direction until point 2.
Another thing that you can look at to help you define the primary trend on your time frame is the sizes of the candles. Generally, the larger, faster moving candles will be going in the direction of the major trend, while the slower, smaller candles will be going against the trend. Looking at the first chart, you can plainly see the larger candles are green in the uptrend, and red in the downtrend.
One suggestion I have to new traders is to use smaller time frame trendline breaks to give them “permission” to go long or short to join the larger time frame trend. How many times have you tried to buy bottoms or sell tops, continually getting stopped out until the trade finally works? Here is one way to fix that.
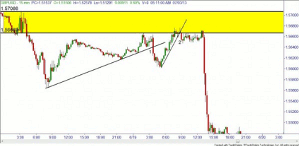
This picture is a zoomed in view of the larger time frame, using a 15-minute chart.
At point labeled 1, the smaller uptrend inside the bigger downtrend has broken, giving you permission to look for short trades. Where to short? In quality supply zones, of course. This break wasn’t in the supply zone marked. When the second trendline broke at point 2, the price was in the larger time frame’s zone.
One more thing about trading with larger time frames—I believe the “quality” of your trades will improve. As a trader, are we paid on the quantity of trades or the quality? Quality, of course! My own belief is that trading with larger time frames is easier than small time frames. If you want to scalp to earn the spread, go back to 1995 and trade stocks with Level 2. In a month, I would rather take ten trades to net 400 pips than one hundred trades to net 400 pips! Having more free time is a huge benefit to trading from larger time frames. How often do you need to check your trades/charts when trading from a four-hour chart? Only once or twice a day! What will you do with all of that extra free time? I personally like to go to the driving range, walk my dogs, and believe it or not, travel around the country and teach classes once or twice a month. It’s a nice break from checking the charts!
The main take-away I’d like you to get from this week’s newsletter is using a smaller time frame trend break in a larger time frame supply or demand zone to join the bigger trend. Eventually, this type of chart pattern will make a lot of sense (cents)!
By Rick Wright, Instructor, Online Trading Academy


