
Trend lines are one of the oldest and most widely used tools in technical analysis, and they indicate levels of supply and demand where a big move is likely to take place, says Jeremy Wagner of DailyFX Education.
The recent EUR to USD strength has caused the exchange rate to move higher into a five-year resistance trend line. Since a five-year trend line will likely produce a more violent move than a five-day trend line, the EUR/USD rate stands near an important level that many traders are expecting big moves to develop from.
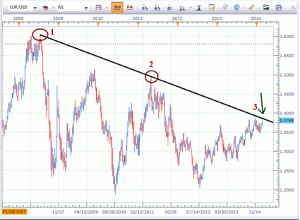
EUR/USD 5-Year Trend Line
(Created using FXCM’s Marketscope charts)
Click to Enlarge
As you can see from the chart above, if we draw a line connecting the July 2008 high (point 1) to the April 2011 high (point 2), we obtain a downward sloping trend resistance line.
Prices have been hovering near this resistance line since the last week of December 2013 (point 3). This line currently crosses near 1.3850 so expect price volatility to pick up.
Most traders are likely using this trend line as a level to initiate short positions. Don’t be surprised to see the pair spike higher to fool those line watchers into thinking the trend line is breaking in favor of higher prices. A daily close above the December 27, 2013 high of 1.3892 would be enough of a break to close out any short positions.
Since this is a five-year trend line, whether it holds or breaks, there are likely some big moves in the EUR/USD on the horizon.
Try trading the EUR/USD for yourself. Enroll for a free practice account, draw the tend line, and place a trade based on this widely used trading tool.
By Jeremy Wagner, Head Trading Instructor, DailyFX Education


