
Greg Michalowski, of ForexLive.com, analyzes the monthly, hourly, and 5-minute charts to determine what they are saying about this currency pair that has moved up over 8% since bottoming on October 15 and continues to trend higher.
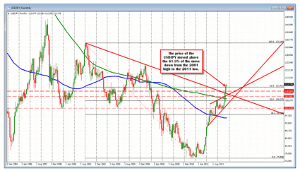
The USD/JPY has continued the surge higher after Friday’s surprise stimulus measures from the BOJ. From a technical perspective, the price has moved above the 61.8% of the move down from the 2001 high to the 2010 low at the 112.41 level. The price is trading the highest level since December 28, 2007. The USD/JPY has moved up over 8% since bottoming on October 15 at the height of the stock market decline off of the Ebola and US growth concerns.
Click to
Enlarge
USD/JPY moved above and away from the 61.8% of the move down from the 2001 high.
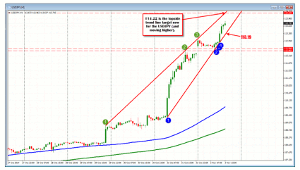
Looking at the hourly chart below, the price gapped above the high from Friday at 112.46. The low Monday comes in at the 112.56. The next topside trendline on the pair comes in at the 114.225 currently and moving higher. The high for the day Monday is 113.86. The low trendline connecting most recent lows comes in at 113.19. With the price in-between at the 113.74 level, trading is about the bias. The bias is bullish. The risk defining level is not so great with the price quite a ways from the support on this chart.
Click to
Enlarge
The USD/JPY is between topside and bottom trendline at 113.19 and 114.22 currently.
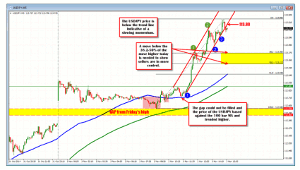
What is the shorter 5-minute chart saying? The 5-minute chart is showing a bullish bias but the momentum is slowing a bit after a move of 130 pips from the low Monday, to the high. The price has recently moved below the lower channel trendline, which does not necessarily end the uptrend but says that buying momentum is a touch slower. Putting a Fibonacci from the low to the high Monday has the 113.365 as the 38.2% and the 50% at the 113.21 level. This level also corresponds with the trendline on the hourly chart (at 113.19). So, this is a key support level below. If the sellers are to take back some control, they need to show they can push the price below these levels. If they cannot, the buyers remain in control. Can traders lean against the high with the price below the trendline? You can, but I make it a rule that, if the price goes back above the high, then all bets are off. Trends are fast and directional and have larger trading ranges and that is what we are seeing in this pair. So be careful trading against it.
Click to
Enlarge
USD/JPY 5-minute chart is showing some signs of slowing but buyers remain in control.
By Greg Michalowski of ForexLive.com


