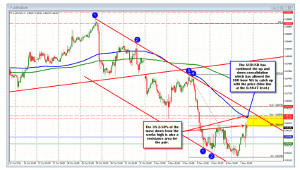
Greg Michalowski, of ForexLive.com, charts this currency pair that was chopping around—like most others—post employment trading on Friday. Since the pair was moving closer to the resistance area towards the close, this week will likely test the selling bias.
The AUD/USD—like most of the currency pairs in Friday’s NY session—is chopping around in post employment trading. In reality, since the sharp fall last Wednesday, the price for the AUD/USD has been consolidating in up and down trading.
This consolidation has allowed the 100-hour MA (blue line in the chart below) to catch up toward the price. This will be a technical level that will likely be in play in early trading this week and should force the market to decide which way it wants to go.
At the highs last week on Wednesday, the price held that MA (see blue circle 3 in the chart below) and that helped contribute to the sharp fall lower.
Will the sellers continue to keep the price below that MA at the now lower levels? That will be one of the technical clues (and risk defining levels) in trading likely this week. Also near the MA level is the 38.2-50% of the move down last week at the 0.86244-0.86505 area (yellow area). Needless to say, this area should define the bias going forward and can also be used by traders to define and limit risk.
On the downside, the 0.8587 is the midpoint of the days trading range Friday. If the price moves below this level, then there may be some additional reversal of the move higher.
AUD/USD moves toward resistance area as the week moves toward the close last Friday. This week will likely test the selling bias.
By Greg Michalowski of ForexLive.com


