
Ryan Littlestone, of ForexLive.com, takes a technical look at this currency pair, highlights why shorting it would have been the best trade of the year had he been in it, and explains why he’s more comfortable looking for longs around current levels than he was during the prior range.
The short USD/JPY trade has been the best trade of the year I haven’t been in.
While the top looks to have sorted itself out, we need to see how we do at the bottom, wherever that may be.
We’ve a potentially good support point at 116.34 ahead of the 38.2 fib of the Oct 105.19/121.84 swing at 115.48.
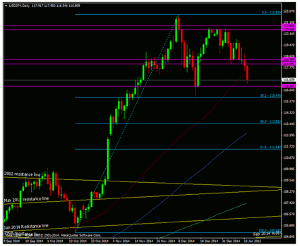
USD/JPY Daily chart 14 01 2015
Click to Enlarge
If we are to develop a range, then we in the ballpark area to see the lower bound develop. Watching how we perform around the 116.34/55 area will be key to that. Test it and hold and there can be greater conviction to a long. Fail and the 115.48 level becomes a potential line in the sand.
There’s not been a big reason why the price has tripped up but it’s not unexpected given the action at the top. I was worried that the yearly range, so far, was too narrow at around 200/260 pips and this move south brings it to something I’m more happy with.
I’ll let the price action do the talking, but I’m more comfortable in looking for longs around these levels than I was in the mid 118s.
By Ryan Littlestone of ForexLive.com


