
By Chris Vermeulen of TheGoldAndOilGuy.com
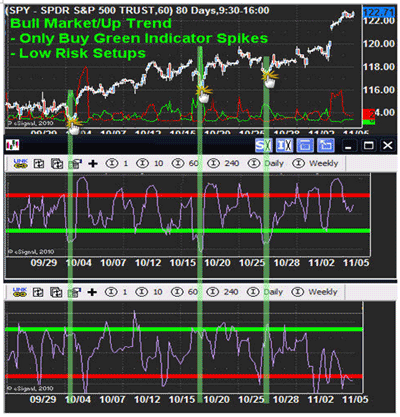
Over the past few weeks, the number of e-mails I have received on a daily basis about what individuals should do about short positions has increased dramatically. In my own personal version of a leading indicator, usually when my inbox starts to fill up with traders holding heavy losses trying to pick a top, I know something big is about to happen, and it’s not going to be in the favor of the herd of shorts. In the past couple weeks, there have been some great entry points for the broad market, whether it’s to buy the S&P 500, Dow, Nasdaq, or Russell 2000. I focus on trading with the trend and entering on extreme sentiment readings, as shown on the chart below.
Extreme Trend Trading Analysis
Below are my main market sentiment indicators for helping to time short-term tops and bottoms. That being said, I don’t pick short-term tops in hopes of profiting on the down side. Rather, I wait for an extreme sentiment bottom to be put in place, then enter long with the uptrend (buy low).
Once there is a 1-2% surge in price and sentiment indicators are showing a short-term top, I like to pull a little money off the table to lock in some profits while still holding a core position (sell high). This is exactly what myself and our subscribers have done over the last couple weeks. This is a simple, yet highly effective strategy, and it works just as well in a downtrend, except I focus on shorting extreme sentiment bounces. Subscribers know what these indicators are as I cover them each week in my pre-market trading videos as we prepare for the day ahead.
Click
to Enlarge
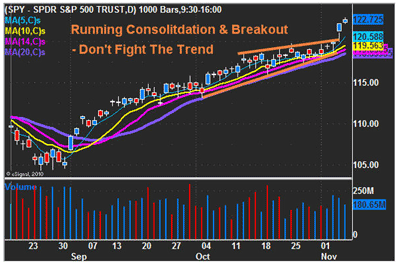
SPX Running Correction
Since early September, the equities market has been on fire. In late September, the market was extremely “toppy” looking and trading at key resistance levels from prior highs, convincing a lot of traders to take a short position. But instead of a correction, the market surged and has since continued to grind its way up week after week.
This rising choppy price action can be seen two ways:
- As a rising wedge with a blow-off top (bearish), or…
- As a running consolidation (bullish)
The running consolidation happens when buyers are abundant and picking up more shares on every little dip. Overall, looking at the intraday price action, you will see market shakeouts as it tries to buck traders out before it continues higher. This choppy looking market action, if not read correctly, looks extremely bearish to the novice trader, and given the fact the market is so overbought, it easily convinces them to take short positions. This choppy action is just enough to wash the market of weak positions before starting another run up.
All that said, both a blow-off rising wedge and a running correction are very bullish patterns for a period of time. Again, I cannot state it enough, trade with the trend and the key moving averages!
Click
to Enlarge
NEXT: Timely Look at Gold, Gold Stocks, and Crude Oil
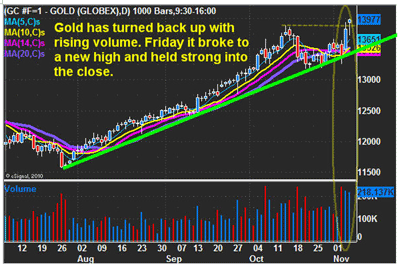
|pagebreak|Gold Shines on Daily Chart
The gold story is straightforward really: Trend is up, quantitative easing is back in action, and that is helping to list gold and silver prices. Key moving averages have turned back up and gold closed at a new high, which shows strength.
Click
to Enlarge
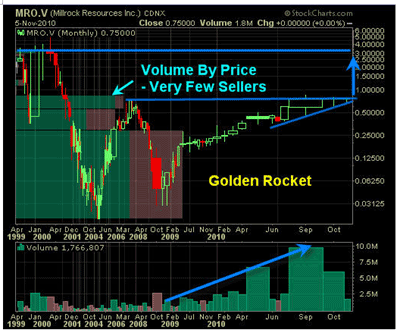
Golden Rocket
With another round of quantitative easing just starting and gold making another new high last week, there is a very good chance gold stocks will rocket higher in the coming eight months. I have been following Millrock Resources Inc. (MRO.V) because of the team involved with this company. A breakout to the upside here could post some exciting gains if you take a look at the chart and see where the majority of volume has traded over the years along with the bullish chart patterns (cup and handle/rising wedge) with strong confirming volume. From 84 cents to the $3.50 area, there should not be many sellers other than traders slowly taking profits on the way up.
Click
to Enlarge
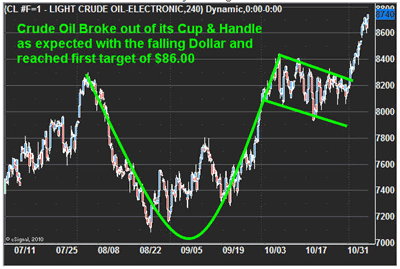
Crude Oil Breaks Out of Cup
Crude oil has been dormant the past few weeks, even though the US dollar has plummeted. But last week’s news on more QE was enough to send oil higher. The surge took oil prices straight to the 2010 highs, as expected, and blew past my first target of $86.00 per barrel. I figure it will consolidate here for a while until we see if the dollar bottomed last week or is just testing the breakdown level.
Click
to Enlarge
In short, the market has played out exactly as we planned, and all four of our positions are deep in the money. As we all know, the market goes in waves in both price and for trade set-ups. The past couple weeks were great for getting into trades, and now the market is running in our direction. It will take a few days for the market to stabilize (pull back or pause) before we could get anther round of trade set-ups. Keep position sizes small as the market remains overbought and a sharp correction could happen at any time. Until then, keep trading with the trend.
Disclaimer: I own shares of SPY and MRO.V
By Chris Vermeulen of TheGoldAndOilGuy.com


