
Greg Michalowski, of ForexLive.com, takes a technical look at EUR/USD, which has gone from the 3rd lowest range for the year last week to the 3rd largest this week. And while he feels there’s work to be done, Greg points out that, at least for the sellers, some of the bullish froth has been taken away in the early NY trading on Thursday.
The week range is up to 492 pips, but comes off in early NY trading.
Last week, the EUR/USD range was the 3rd lowest range for the year. This week, it is the 3rd largest range for the year. Non-trending to trending.
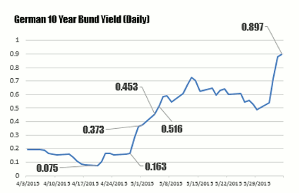
The German bund yield (and other European yields for that matter) has risen. Moreover, the spread to US treasuries has narrowed, Jeffrey Gundlach from Doubleline Capital and noted bond guru, said on CNBC Wednesday that yields in Germany would likely continue to rise. The 10-year yield was as low at 0.075% on April 20, 2015. Note, however, that the bund has recovered and is trading near high price levels for the day (low yield levels) on Thursday.
Click to Enlarge
Looking at the daily chart, the pair has stepped higher over the last three days and on each day has been able to build off a technical level. On Tuesday, the price moved above the 38.2% and the 100-day MA. The price stalled at the underside of a broken trend line. On Wednesday, the low based off the 100-day MA and moved above and closed above the aforementioned trend line. The high extended up to a resistance area between 1.1261 and 1.1289. Thursday, the low based against the old trend line and surged once again. The high Thursday did fall short of the next target at the 1.1391 level.
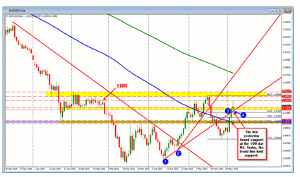
Click to Enlarge
The pair is finding some sellers in the early NY trading, however. 1Q productivity was weaker than expectations as wages were better than expectations and Jobless claims stayed near low levels at 276K. Continuing claims were the lowest since November 2000.
Looking at the 5-minute chart, the pair has moved back below the day’s midpoint and the 100-bar MA (blue line in the chart below) at the 1.1304 area (close resistance?). The close from Wednesday comes in at the 1.1272 level. The low so far is at 1.1285. The 200-bar MA on the 5-minute chart is at 1.1284.
I think the sellers might be feeling better, but let's face it…the price is still up on the day. The sellers have been at a disadvantage this week. And, technically, some key levels were broken. There is work to be done, but at least for the sellers, some of the bullish froth has been taken away in the early NY trading. Get below the close from Wednesday, and make it a negative day, and that will be something new. The Asian Pacific low came in at 1.1253. That level acted as a base in early European trading as well. So if it can get there, I would expect a slowing against it.
PS. The trading volatility is certainly up this week. Thursday's range of 150 pips is nothing compared to the 206 and 272 from the prior two days.
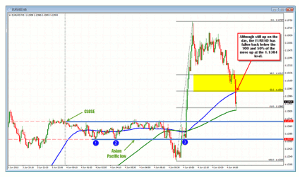
Click to Enlarge
By Greg Michalowski of ForexLive.com


