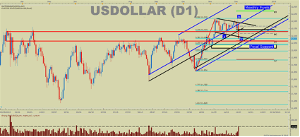
Tyler Yell, of DailyFX.com, takes to the charts to answer this question and highlights the key level to watch moving into the weekend. Tyler stresses that if the US dollar fails to break above the opening range high for December, it could be in for another rough month to close out 2015.
Talking Points:
• US Dollar Technical Strategy: Deep Drop Takes Price to 38.2% Fibonacci Support• All Currencies Bow to EUR Thursday with Large Sentiment Shift, US Dollar Included
• Eyes on Trend Resumption with NFP and December 16 FOMC in Focus
The US dollar barely missed new 2015 highs on Wednesday as Janet Yellen discussed the dangers of waiting too long to hike rates. Waiting too long, she argued, would potentially lead the Federal Reserve to aggressively high rates down the road, which is something they want to prevent for fear of causing negative risks on too aggressive of a rate shock as a recovery gets underway. Thursday, US dollar and Janet Yellen’s Joint Economic Committee took a backseat to Mario Draghi. Thursday, Mario Draghi and the ECB opted to extend their quantitative easing program while cutting the deposit rates and cutting their outlook. Surprisingly, this outcome was not bearish enough for markets and the euro rocketed across the board. EUR/USD as of 1:00 PM ET had a daily range of 425 pips and the technical picture feels oddly similar to the March 13 bottom. This sharp move in a quartile of the US dollar index has caused a sharp drop through previously mentioned key support. However, even with this dollar sell-off, highly correlated markets to the US dollar like the UST 2yr Yield is sitting at the highest level since 2010 and the Eurodollar Futures market that prices in short-term USD denominated debt is pricing in higher rates, which would suggest USD strength. Therefore, the question on our minds is whether or not this US dollar strength should be taken as a sale on a highly desired currency in the US dollar or a sign of more weakness to come? Let’s look at the charts (click chart below to enlarge).
Thursday is the largest high/low range in US dollar since August 24, which was the current low in the US dollar since July. The current range is 124 points and we could continue pushing lower, but it’s not sure whether or not we’re about to turn higher after this 20+ day sideways move. Now it looks like the price could be moving into the support that makes US dollar an attractive buy given risk: reward opportunities. You’ll also notice on the chart below that we’re moving toward the crucial Fibonacci zone that makes up 38.2%-61.8% of the prior range from October-November. The first support level in focus is 12,064, the March 13 low and Monthly S1 Pivot low. If we get a beat Friday on Non-Farm Payrolls and the price pushes higher, we could get a resumption of the uptrend. Prior support has not turned to resistance at 12,108. A daily close Friday above 12,108, the proposed A wave low (Elliott Wave terminology) could help bring confidence back to the bullish camp once again. If we end up breaking above the opening range high for December, I’ll be in the bull camp. Without a break of the December high of 12,212, the US dollar could be in for another rough December.
By Tyler Yell, Trading Instructor, DailyFX.com


