Citing a number of FX trades he's made this year from a technical perspective, Zaheer Anwari, of TheDynamicTrader.com, rebukes the common misconception that a trader must be pulling trades daily. Instead, he explains that the correct mindset is to be trading on the right days as opposed to every day.
This 2015 year has been quiet since April with the FX market going into consolidation following the last round of trends. The EUR/USD and the USD/SEK were two of the most profitable currencies I traded, offering excellent compounded growth across multiple positions held from September until April when my trailing stop losses was eventually triggered.
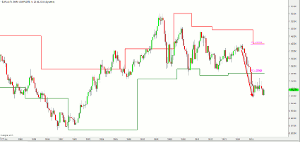
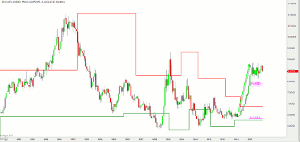
Below are both the monthly charts of the EUR/USD and the USD/SEK highlighting those highly profitable trends.
June offered the next round of entry points on currencies such as the NZD/USD and the GBP/AUD—amongst others—but these trends were short lived as price soon went into consolidation with little growth achieved from trades in play.
The summer periods of July through to August are generally quiet as can be expected. However, natural market movement again usually dictates breakouts and trends post summer from September onwards through to Christmas and into the New Year, but this year those breakouts did not emerge.
Patience is a key trait to a top trader and one which is least appreciated and least respected. A common misconception is that a trader must be pulling trades daily to be considered a trader. The correct mindset is to be trading on the right days as opposed to every day.
For as long as price remains in a range bound market, we must stand aside. A consolidating market is an environment where profit made is short lived, and in addition, to a higher risk of losses. A market can remain in a range for months. As a trend trader, I detach myself from the markets during these periods and do not allow frustration to get the better of me. I simply stand aside until price dictates a break out, with emphasis on capital protection as opposed to profit generation.
(As a side note, I should add that generally when one market (say FX) is in consolidation another (say US Stocks) is in trend, which eliminates the need to overtrade in consolidating markets.)
December has finally offered the first breakout in the form of the USD/CAD and an entry point which aggressive traders will have taken but at reduced risk. Risk allocation is no more than 2% per trade so this will have been taken at 1% or even 0.5%.
NEXT PAGE: Where I Look for Major Areas of Support and Resistance
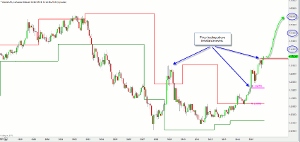
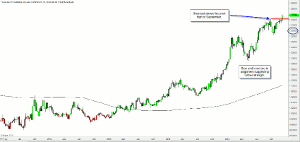
|pagebreak|The monthly chart below gives us a clear picture of price structure over the years as well as where I look for major areas of support and resistance. Price has been in a bull trend since 2011 and—as the trend is your friend—that is the direction we want to be trading in.
Currently, price is trading above the high of 2014 (pink line labelled PH), the 2009 pivot resistance, and the round number 1.3000 which is acting as a support zone. The breakout this week took price through the pivot high of September of this year, which is a good sign of a possible continuation of the trend. We would now like to see price move towards the round numbers of 1.4000, 1.5000, and potentially even 1.6000, given that price traded at this high back in 2002.
This is a distance of circa 2500 pips, which can leverage to far more with compounding and correct risk management if one understands how to hold positions for months over the duration of a trend.
As a reminder, technical analysis is looking at past price action to assume levels that current price action could move towards.
I use the weekly and the daily time frame to look for alignment in trend direction. This then gives me high-probability environments where I have more chance of returning a profit and seeing long-term growth.
The 200MA is used to give the overall bias of the market. This logic goes back to before the dawn of the Internet when charts and indictors were drawn and calculated by hand. Traders were very particular about what they put on their charts in terms of what was considered useful and what was simply noise. The 200MA proved to be a very good indicator of the overall trend direction.
When price is trading above the 200MA, we look for only long opportunities and when below we only look for short opportunities.
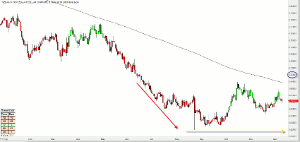
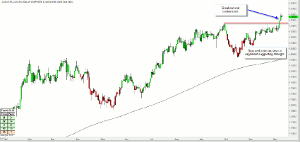
Below is the weekly chart where we can see price is trading above the weekly 200MA giving price a bullish bias (and I have a proprietary trend filter which is colouring the bars green), suggesting price is in a bullish trend. The bias and trend are in alignment. The weekly chart also shows the breakout above the pivot high of September in more detail.
Below is the daily time frame where we can see that price is also trading above the daily 200MA giving price a bullish bias, and the trend filter is also green, suggesting that price is in a bullish trend. The bias and trend are also in alignment.
Looking at the overall picture across all time frames, price is clearly in a bull trend and trading above the immediate levels of resistance. There is a clear run of space to a potential high of 1.6000 and we also have alignment on the weekly and daily time frame in terms of bias and trend.
Given the way price had set up, this was a simple trade to take and one that is currently running in profit. As a trend trader, I am now looking for this current linear trend to continue with neat pullbacks and clean breakouts, which will allow me to compound or add further positions.
By Zaheer Anwari, Senor Trader and Mentor, TheDynamicTrader.com

