
The Russell 2000, Nasdaq Composite, and Value Line Geometric indices have pushed their way back into record high territory, asserts Dan Sullivan, technical expert and editor of The Chartist Mutual Fund/ETF Letter.
That in itself is a big plus for the market because, as you know, the most bullish thing the market can do is go up and set record highs in the process
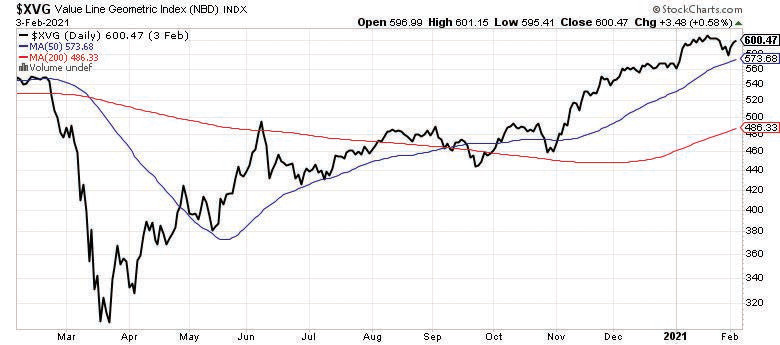
In particular, the ability of the Value Line Geometric to close at all-time highs today was most encouraging. This is one of our favorite indices because all of its components are equally weighted.
Many analysts contend that it gives a better picture of the market’s overall condition than the weighted indices such as the Dow. It takes only five or six heavily weighted stocks to move the Dow higher while the majority of its components are losing ground.
The Value Line Geometric that tracks some 1,680 stocks has a history of recording its highs of the cycle well in advance of the major averages.
As an example, let’s examine the prelude of the last bear market that began back in 2007. It will be recalled that the Value Line Geometric topped out on July 13th of that year some three months ahead of the S&P 500.
You know what happened after that: All of the major averages proceeded to lose more than half of their value over the following 15 months. The small caps took the biggest hit with the Russell 2000 losing 59% while the Value Line Geometric lost almost 70%. It was not a pretty sight.
The Value Line Geometric also gave ample warning before the unraveling of the dot com boom. We first became aware of the Value Line Geometric’s lead time back in the early 70s that led up to the devastating 1973-74 bear market.
As you can see by the chart below, the Advance Decline (A/D) Line has broken through its previous record highs set on January 20th with authority. This indicator also has a long history of topping out ahead of the key averages.
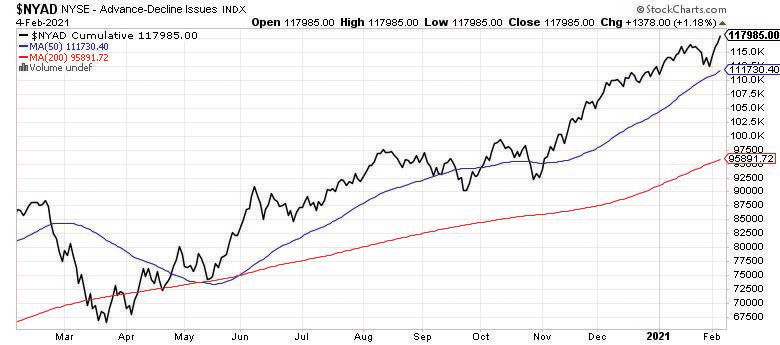
As previously noted, the last bear market got underway in October of 2007 while the A/D Line topped out on June 4th of that year, a good four months earlier.
It has given ample warning in advance of the majority of bear markets — especially the major bear markets, such as 1929, 1973-74, 1987, and 2000 2002. Our advice is to remain in a 100% invested position.
In our opinion, there is little doubt that we are in a bubble comparable to the dot com boom. If history is any guide, it is going to end badly. In the meantime, it is a bull market until we see evidence to the contrary and, in bull markets, you want to be fully invested.


