
Payrolls grew by only 22,000 in August versus the estimate of up 75,000. The household survey was better as it showed a gain of 288,000…but that just offset the drop of 260,000 in July. Bottom line: This jobs data is further evidence of the slowing pace of hiring that we’re seeing in many other places, counsels Peter Boockvar, editor of The Boock Report.
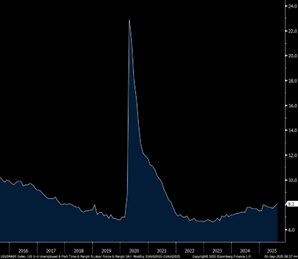
The size of the labor force rose by more, 436,000, so the unemployment rate ticked up by a tenth to 4.3%. Of particular note, the U6 all-in rate rose to 8.1% from 7.9%. That is the highest since October 2021.
Unemployment Rate
Also of note: The average workweek was 34.2 vs the estimate of 34.3...and that was only 0.1 point from matching the lowest since 2010. The participation rate was 62.3%, up one tenth after falling by one tenth in the month before. Positively, the participation rate for the key 25-54 age cohort rose to 83.7% from 83.4%. That is the best since last September.
Still, the average duration of unemployment rose to 24.5 weeks versus 24.1 in July and 23 in June. That’s the most since April 2022. Plus, those working part time because they can’t find full-time work rose to 1.308 million, the second-highest since the depths of Covid.
After the data came out, rate cut odds rose to 100% for September (with a slight 10% chance of 50 basis points, which I don’t think Jay Powell will do). Rate cut odds for the late-October meeting climbed to 82% versus 52%. Odds for a third cut by year end rose to 60% versus 24% before the numbers.


