New York Traders Expo speaker Corey Rosenbloom explains how he uses the NYSE TICK indicator to spot extremes in the market and why many traders misinterpret TICK readings.
For those of you who use the NYSE TICK in your intraday trading, it’s very important to understand that the reference TICK extremes—highs and lows—changes as a factor of market volatility.
See also: Secrets of the NYSE TICK Indicator
What that means is that you can’t just call a +1,000 or -1,000 TICK reading “extreme.” The value of “extreme” cycles up and down over time.
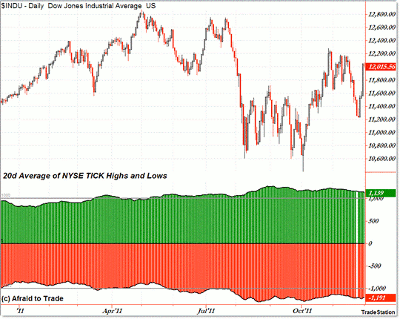
Let’s look at the current reference levels along with the levels that have changed in 2011 so you can get a more accurate reference of what counts as an intraday TICK extreme that you use to factor into your trading decisions.
The combination chart above doesn’t show the finer details, so we’ll look next at TICK highs and lows separately to get a better picture.
What we’re seeing is the Dow Jones Index (could just as easily be the S&P 500 or other leading US equity index) on the top and a special custom indicator below that shows the 20-day simple moving average (in histogram form) of the intraday TICK highs and TICK lows.
You can see that the average is compressed (under +1,000 for average TICK highs and over -1,000 for average TICK lows) during periods of low market volatility and expanded for periods of high volatility.
Let’s pull it apart to see the data clearer and gather what this all means:
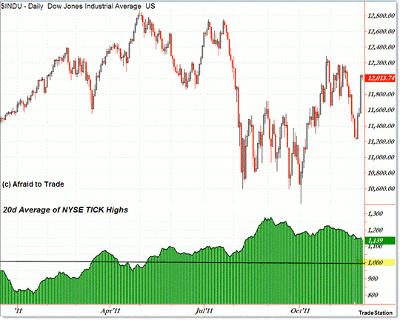
What we’re seeing above is the 20-day average (in histogram form for clarity) of the NYSE TICK highs. Remember, this isn’t the plain TICK, but roughly a monthly average of TICK highs.
At the start of 2011, volatility was lower, and thus, the average intraday TICK high was closer to 850-900. That meant that 850-900 was the “extreme” intraday TICK high to expect at the time.
Volatility increased throughout the year, as did the intraday extreme level we could expect to find TICK highs.
In fact, the 20-day average of TICK highs peaked at the end of September at 1,300. The current average TICK high is 1,139.
Let’s drive home that point.
NEXT: Critical Point About Using TICK in Volatile Markets
|pagebreak|Some intraday traders use the TICK either as a trigger to enter a new position or to exit an old (profitable) position with the following logic: Intraday price swings tend to reverse on intraday TICK extremes.
I’ve heard it many times where traders will use the round number 1,000 as their trigger. They’ll put on a short-sale position when they see a TICK reading of +1,000 or otherwise exit a long (buy) position when they see a +1,000 TICK reading flash on their screen.
What the above data shows is that using a round number such as +/- 1,000 is insufficient reference simply because the reference level—what constitutes an “extreme” or “overbought” TICK reading—changes as a factor of broader market volatility.
Traders who fail to understand this concept risk two negative outcomes:
- If the average intraday TICK high is +1,300 and a trader immediately puts on a short-sale when the TICK hits +1,000, the trader has a high probability of being stopped out for a loss as TICK—and price—continue higher beyond the +1,000 reading
- A trader who uses a +1,000 TICK to exit a bullish/long position leaves money on the table in the trade as price continues higher and TICK goes on to peak for the day near +1,300
A trader who incorporates TICK volatility—or the fact that intraday TICK extremes change over time— has a better chance to adapt the strategies to the new “normal” (average) in TICK extremes and thus reduce losing trades and squeeze more profit out of winning trades (using this strategy).
The logic (and data) is similar for -1,000 TICK readings on the downside:
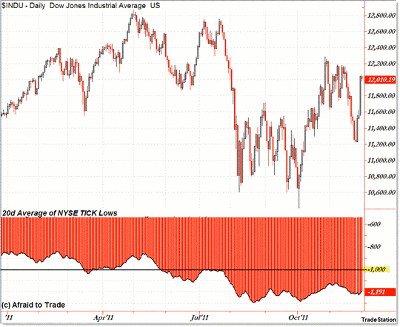
We see the same type of situation mirror average TICK lows as we saw above in average TICK highs.
The start of the year gave us average intraday TICK low extremes greater than -1,000, while the latter part of the year gave us intraday TICK low extremes less than -1,000.
The same dangerous logic applies in terms of using -1,000 as your flat baseline:
- Traders who go long at a -1,000 TICK reading face significant losses when the average TICK extreme low is -1,200
- Traders who exit short positions at a -1,000 TICK reading risk leaving money on the table as price falls lower (and TICK lows expand to -1,200 or -1,300 per the average).
All you have to do is keep a running average of the TICK highs and lows on a daily basis, preferably a 20-day (one month) average, which can be done in Excel if you do not have software where you can automatically plot a moving average of TICK highs and lows.
By Corey Rosenbloom, trader and blogger, AfraidToTrade.com


