Vin Maru of The Golden Trader explains how the Gold Bugs Index (HUI) may set up for a trading opportunity if gold corrects or remains in its current trading range.
At the beginning of last week, gold was still in the up channel, but something to watch for is gold diverging out of the channel, a move that could signal the start of a correction.
Last Thursday and Friday’s price action (Feb. 9-10) was concerning for short-term trading going into this week because gold is no longer in the strong up channel that has been in place for the last six weeks.
We mentioned that gold was bumping up against resistance at $1750 and that a reversal could be in the making. Gold most likely will continue its correction and sideways pattern during the early part of this week.
The first few days of this trading week will help to determine if gold still remains in the sideways channel that is now developing between $1720 and $1750. If the sideways channel holds for the first few days, then new long positions should be initiated at the lower end of the channel around $1720 with a tight stop loss.
We may consider selling our trading positions as gold gets closer to the top of the range at $1750, depending on the first few days’ trading action.
If the correction continues early in the week, then gold can move back towards a stronger support zone between $1665 and $1680, which is where I would feel more comfortable initiating new positions or adding to existing ones.
That would be a great time to add to physical holdings, where the prices converge around the 50-period displaced moving average (DMA) and the 200 DMA. If we do see the price of gold test this support zone and hold, we will look at initiating new trading positions.
Technical Analysis
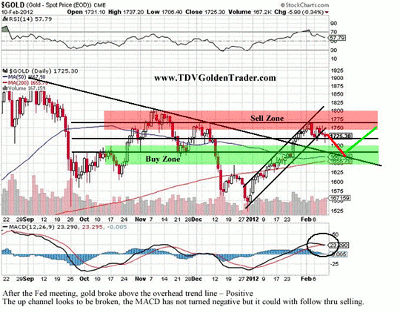
After the Fed meeting, gold broke above the overhead trend line, a clear positive. Since the beginning of 2012, gold was trading within an up channel, but now is going sideways out of that channel. That is a neutral sign for now with a negative short-term bias.
The RSI has been coming down since the beginning of February when it hit a high above 70 (bullish); it’s now at 57.8 and working off overbought conditions. Look to enter long positions when the RSI approaches 50 or slightly lower.
The MACD was rising but is not starting to flatten out; it has yet to turn negative, so the sideways channel still holds. If we see gold start to sell off early in the week, then the MACD will most likely turn downwards with a fresh cross as we move to lower support levels.
This week’s trading range:
- Support: $1720, $1680, and the 50 DMA at $1665 (strong buy)
- Resistance: $1750, $1775, and then $1800 (exit trading positions)
NEXT: Gold Bugs Index (HUI) Is Likely to Follow Suit
|pagebreak|Gold Mining Sector Index
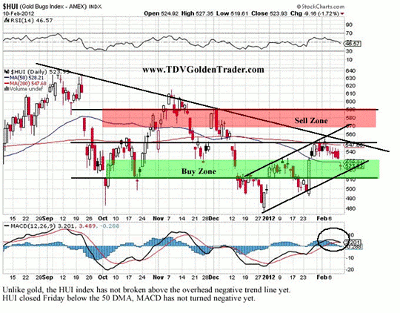
Unlike gold, the Gold Bugs Index (HUI) has not broken above the negative trend line just yet, so for the moment, mining shares are still underperforming the gold price. Friday’s price action in $HUI is concerning because it went below the 50 DMA and stayed there; we were hoping the 50 DMA would act as support.
We don’t think this is a major break down of the index, however; we are most likely testing the lower part of the up channel that has been in place since the beginning of the year.
Depending on which way gold trades this week, HUI will most likely follow. If gold sells off early Monday towards $1720 (maybe $1700), the HUI index will most like trend down towards 520 (maybe 510) and test the bottom channel line. That is when we will evaluate adding to new positions or exiting our trading positions, depending on how gold behaves on Tuesday and Wednesday.
At the moment, HUI is at the lower end of the trading range, but the mining stocks in general are neither a buy nor a sell.
Over the last few weeks, we mentioned placing low-ball bids on the stocks we like, but we didn’t want to initiate a lot of new positions when gold was bumping up against resistance. We suggested placing low bids about 10% below market stock prices, and now the stocks are coming within a price zone where we would feel more comfortable adding to our trading position one more time.
The strategy is to have your position early enough so that we can start selling into major rallies at higher prices during the first half of this year. At the moment, I really don’t think there is a need to chase prices; let them come to our bid price, which is at new support levels.
This week’s trading range:
- Support: 520 at the lower channel line; if it fails, then 510 is likely this week
- Resistance: 550 at 200 DMA; if there is a bullish move in gold, resistance can be bumped up to the 575 range
By Vin Maru of The Golden Trader
At TDV Golden Trader, we are finishing up another special report on internationalizing your physical gold holdings. This will be available to all TDV subscribers very shortly. If you do not have any exposure to physical gold, you may want to listen to this past weekend’s broadcast of Financial Sense with Jim Puplava about gold. He does a great job on why you need to have the physical gold and things to consider when buying gold.
Over the weekend, we updated subscribers with a summary of our core and trading portfolio, an overview of our positions, and many new additions to our watch list. Subscribers should read the Weekly Overview to stay updated on our positions.


