
With major stock indices now interacting with important resistance from the 2011 highs, traders are particularly challenged when deciding to go long or short, writes Corey Rosenbloom.
Technical traders across the world are monitoring current US equity indexes as they interact with the zone of resistance (“the zone”) from their prior 2011 price highs.
Let’s have a quick checkup on where the “big three” markets stand at the moment in relation to “the zone.”
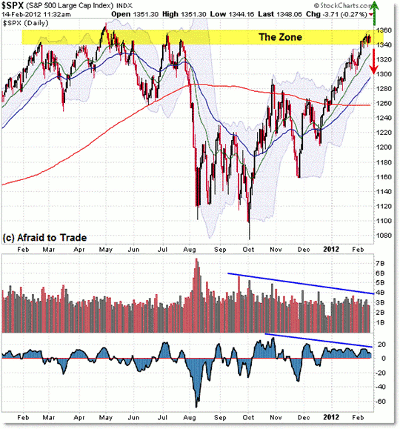
First, the S&P 500, which hasn’t quite cleared the resistance area yet:
Click to Enlarge
For reference, what I’m describing as “the zone” is the cluster of price overlap, or resistance, from the mid-2011 index highs.
This level became important in 2011 when it resulted in price reversals in February, May, and July in the context of a range consolidation period in each of these indexes ahead of the August collapse.
Stocks reversed and bottomed in October and have since been rallying powerfully—in a “Creeper Trend” pattern—ever since.
At present, all indexes are either into the zone of resistance or else breaking gently above it, as is the case of the Dow Jones and Nasdaq (the S&P 500 is the weakest index at the moment, relatively speaking).
As chart traders, we often start with price first and then move to other indicators as confirmation or non-confirmation of what’s happening with price.
Starting at the top, we see an overextended price rally into prior index resistance from 2011.
Going to other indicators, we see negative divergences in momentum and volume, which is a type of non-confirmation of the upward rally.
Strong rallies tend to occur on increasing volume and momentum, and that’s not been the case during the 2012 “creeper trend” rallies.
However, going back to our original foundation, we follow price (including trends) as traders and everything else is secondary to price.
This is an important distinction to make because traders who follow indicators first are likely to be short selling or hedging (or taking profits) into these indicator-based caution signals.
Unfortunately, should price indeed continue trending higher—breaking freely through this resistance—then these same traders will be forced to buy back to cover their short-sold or hedged positions, as other traders will put on new buy positions or else add to existing ones.
This is exactly the logic of a “positive feedback loop,” which supports these sort of “Creeper Price Trends.“ Be sure you understand this logic, as explained in the prior blog posts, which show plenty of examples.
See also: Profit from the Feedback Loop
|pagebreak|Let’s turn now to a quick look at the Dow Jones Index, which has broken slightly above “the zone.”
Again, we follow price as our top chart indicator, and price is currently (arguably) weakly trading above the important 12,800 price level, placing it officially at new recovery highs not seen since the 2008 bear market.
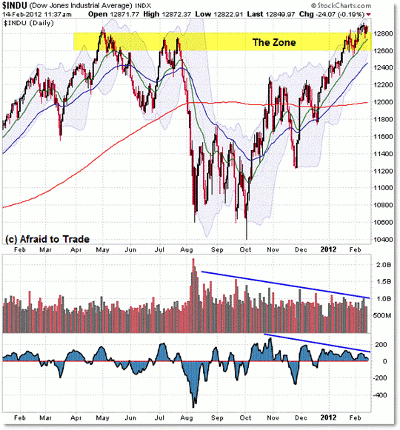
Click to Enlarge
The picture is the same in the Nasdaq, except the recent rally and breakthrough has been stronger, thanks in large part to tech stocks like Apple (AAPL):
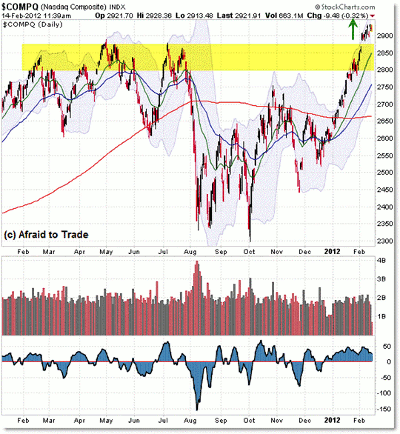
Click to Enlarge
Another point of comparison is that the Nasdaq is showing short-term strength (increases) in both volume and momentum in 2012, unlike the S&P 500 and Dow Jones, which have shown continued declines in both volume and momentum.
Nasdaq volume and momentum, however, are still lower than the levels seen at the end of 2011 during the October/November bottom period.
So, what’s the quick takeaway?
Not much has changed since last week’s triple-index market update.
You can also view last week’s broader view on the monthly picture in each of these indexes; it will be helpful in putting any sort of continued price breakthrough higher in context of the larger bull market trends since the 2009 official bottom.
The equity markets are in a continued conflict between price (trend) and indicators (divergences/overextended rally), which makes it difficult to have strong conviction in your trading decisions, unless they’re on a very short-term basis.
Sometimes, new traders prefer to stand aside when there’s this much conflict between what logically “should” happen and what’s actually happening.
Stated differently, it’s unusual to see day-over-day “creeper trends” without a meaningful retracement. This makes it 1) difficult to get long because you think the moment you get long will be the exact moment the market actually reverses lower; and 2) difficult to get short because despite the logic for at least a retracement, if not another reversal, you keep getting stopped out as price continues its creeper trend higher.
For me, the solution is to stick with intraday charts and trade short-term opportunities that develop—and there have been some decent classical plays each day.
Of course, the situation would be different if we did see a strong rally and continued breakout higher. That would be expected due to “popped stops,” a short squeeze, or positive feedback loop logic.
It’s this price stagnation and indecision within or near the zone of resistance that’s keeping us all on our toes, anxiously awaiting either a breakout higher, a retracement (at the minimum), or even a reversal lower.
Be safe and keep watching the developing structure while being as unbiased as possible.
By Corey Rosenbloom, CMT, trader and blogger, AfraidToTrade.com
Corey Rosenbloom is speaking at next week’s New York Traders Expo (free live Webcast on Monday).


