While the S&P 500 and Dow Jones indices trade slightly above key Fibonacci retracement levels, the Nasdaq already broke that key level, prompting Corey Rosenbloom to assess the latest technical action in all three indices.
After a steady retracement took the US stock market indexes to lower support level targets, let’s take a look at these targets and what index levels we will be watching closely in the week ahead.
Starting with the S&P 500, the key chart levels we’ll be comparing across the three indexes are the 38.2% Fibonacci retracement and the 200-day simple moving average (SMA).
See also: 4 Fibonacci Ratios to Know Inside Out
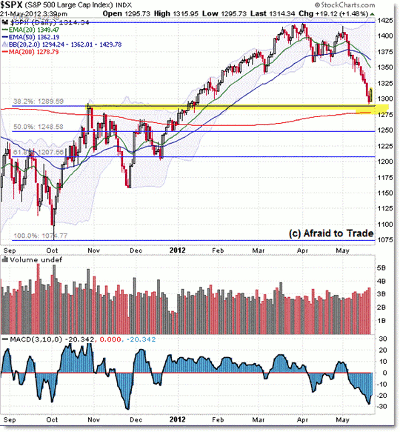
In the S&P 500, the key “round number” psychological reference level is, of course, 1,300, and buyers stepped in throughout the trading day to defend this level.
Beneath 1,300 is the critical confluence of the 38.2% Fibonacci retracement at 1,290 and the rising 200-day SMA at 1,278, making the 1,280/1,290 area the key indicator-based confluence support.
If we stretch back to late 2011, we also see the 1,290 level was a spike high in October, making it a polarity support level.
Quite simply, we’ll be watching the market relative to this level, being cautiously bullish above 1,300 (notice the 20/50 exponential moving average (EMA) cross and price target near 1,350) and otherwise bearish under 1,270.
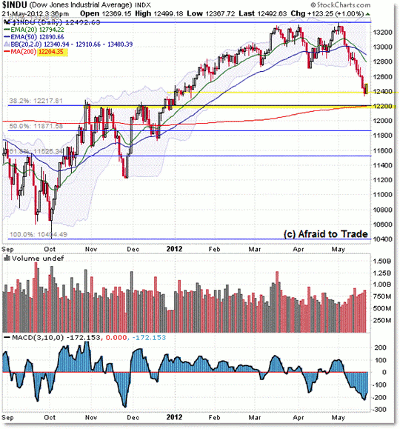
The picture is similar in the Dow Jones Index:
While the S&P 500 reversed at a logical prior price support level, the Dow Jones power rallied off 12,400, which is above the equal confluence of the 38.2% Fibonacci retracement and 200-day SMA at the 12,200 level.
As such, 12,200 will be the indicator-based confluence support, which aligns also with the visual resistance from late 2011.
NEXT: Slightly Different Conditions at Work for Nasdaq
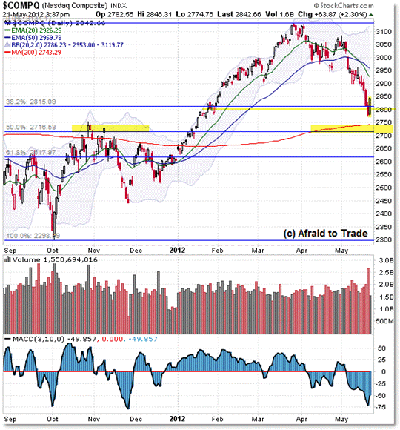
|pagebreak|Finally, the Nasdaq also rallied slightly above its critical confluence:
Unlike the S&P 500 and Dow Jones, the Nasdaq Index actually broke the 38.2% Fibonacci level on Friday (May 18) and clawed back above the 2,800 level.
However, similar to both the S&P 500 and Dow Jones, the Nasdaq also formed its initial rally above the weak confluence near the 2,700-2,750 level.
Again, we reference the late-2011 swing highs in price with the 50% Fibonacci retracement and 200-day SMA.
Be sure to add these reference levels to the trades and analysis you are conducting in these indexes.
By Corey Rosenbloom, CMT, trader, and blogger, AfraidToTrade.com


