But which way will the tech giant swing? Cycle expert Don Pendergast explains his view of the company’s charts.
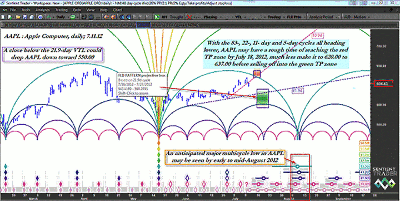
Although shares of Apple (AAPL) had a nice relief rally coming out from its May 17 swing low, cycle analysis reveals that the line of least resistance in the stock may be toward a valuation in the mid–$500 range—within the next couple of weeks. Here’s a closer look now at one of the world’s most popular tech stocks.
Although its 43–day cycle is currently rising, the fact that its 83–day cycle is falling could mean AAPL will have a tough time remaining near $600; in fact, the cyclical probabilities suggest that a drop toward the mid–$500 range may already be underway.
Many kinds of traders love to play AAPL stock, as it tends to make the kinds of explosive intraday moves that daytraders and scalpers thrive on, even as it also tends to move in strong multi–day (multi–week) swing and/or trending moves. Certainly, the stock has been a recent darling of long–term trend–followers, seeing as how it rose relentlessly from $363.32 to $644, from November 25 to April 10.
But how many of those trend followers are aware that it was the rising 17.5–month cycle that got that incredible move launched, with the 41.8– and 22.5–week cycles finally being the ones that drove the final, parabolic rise into April?
There probably aren’t many, but those who are aware of how to track the various cycles in this tech giant’s stocks are likely the ones who remain a step ahead of other traders and investors who typically trade off of news releases and/or lagging technical indicators. At present, AAPL’s valuation is highly driven by declining 83–, 22–, 11–, and five–day cycles, with only the 43–day cycle in rising mode.
The probabilities appear to favor AAPL moving down into the green time–price (TP) projection zone sooner rather than later. This may lead to a drop near $550 by July 23, according to the latest cycle calculations by the Sentient Trader software.
One key indication that may lend added confidence to that projection would be if the dashed blue 21.9–day valid trend line (VTL) support line is violated on a daily close below it. This will confirm the recent cycle high made on July 10, and should unleash even more selling pressure into this market.
Also of interest is the upcoming major multi–cycle low that the software is projecting into early to mid–August. After the current downswing finds support (probably very close to $550), a minor rally may commence, followed by a final washout decline down toward the lower portion of the $500 range.
Should this happen, it could set up a major buying opportunity for swing traders and trend followers. Playing AAPL right now might involve nothing more complex than buying modestly in–the–money puts with two to three months of time value, looking to hold on for a ride south toward $550 to $560 over the next week to ten days.
Consider using a two–bar trailing stop of the daily highs as your trade management stop, and also consider taking early profits on half your position if you are blessed with a sudden one– to two–day plunge in the stock, letting the balance of your position ride until final closeout. And make sure you limit your risk to no more than 1% to 2% of your account value, no matter how you choose to trade this anticipated downswing in AAPL.
Don Pendergast can be found at Linear Trading Systems.


