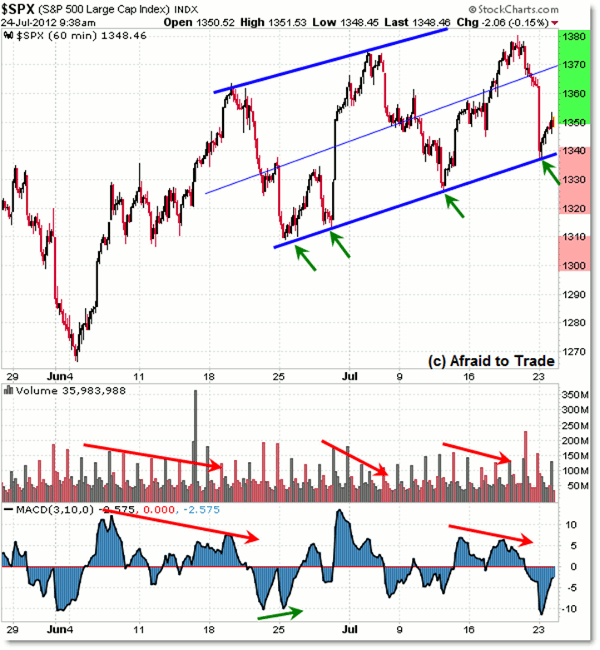
How will the ongoing bear flag play out? Could this be a repeat of last year's massive drop? Corey Rosenbloom takes a look.
As we update the current picture of the S&P 500, we find that not much has changed from last week’s mid-week update, at least in terms of the “Bear Flag” trend line boundaries.
Let’s take a quick look at the current SPX price pattern boundaries and how to develop a gameplan.
This month already, price successfully retested and reversed from the 1,380 upper resistance level all the way back to the current 1,340 support trend line. Monday’s activity resulted in an initial upswing from the 1,340 key pattern support.
For reference, price structure is consolidated between two rising parallel trendline channels, popularly called a “Bear Flag” price pattern. You can think of this also as a classical horizontal rectangle pattern, only this pattern has a slight rise to it—the logic is the same.
Next: The main idea in the short-term...
|pagebreak|The main idea in the short-term is to expect price to continue trading (or bouncing between) between these two trend lines (allowing for intraday bull/bear set-ups) until we see a clear breakout of the boundaries.
Price alternates between periods of price compression or consolidation (like the current pattern) and price expansion or trending moves (like the May 2012 decline or the early 2012 rally). The most recent consolidation phase lasted from March to May 2012—you can observe the “price expansion” phase before and after the two-month consolidation.
We’re currently trading within another two-month consolidation pattern, as seen best on the Daily Chart:
In general, if we interpret this pattern as a pure “Bear Flag” similar to that of August to October 2011, we would be expecting a clean downward break.
Subsequent downside targets extend to 1,300 (round number), 1,270 (2012 low) and then 1,200. These bearish targets develop on a breakdown under the rising trend line.
However, once again, be aware that the August to October similar pattern also had a downside break which failed to reach its full “Bear Flag” projection target. Instead, buyers stormed the market at the 1,100 level.
Perhaps this week will be the one that results in a breakdown of the lower trend line. But just as easily, we could also see a continuation of the pattern and upswing back to the 1,380 or even 1,400 level.
Continue to develop your unbiased short-term strategies around the trendline boundaries and potential for breakdown.
Corey Rosenbloom is a trader and blogger at AfraidToTrade.com.


