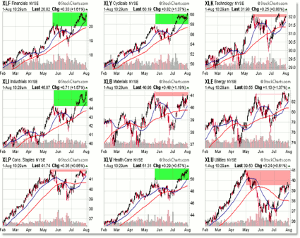
While the S&P 500 itself broke to all-time highs last week, not all sectors participated in the breakout, notes technician Corey Rosenbloom of AfraidToTrade.com.
Swing trading opportunities often come from focusing on strong stocks in strong sectors while avoiding weak stocks in weak sectors.
Let’s take a quick glance at the nine Sector SPDRs (ETFs) and note the relative strength to the recent May high and current breakout:
I color-coded the ETF price performance of the current high (with the SP500 at fresh all-time highs) relative to the ETF’s May peak.
The larger the green rectangle, the greater the ETF has traded ABOVE the May high; also, the greater the red rectangle, the lower the ETF has performed relative to the high.
It’s a very simple way to view sector strength or weakness at a glance.
Based on the grid above, we have three categories of ETF location:
The Strongest:
The Middle of the Pack/Unchanged From May High:
The Weakest:
- XLU Utilities
Again, traders looking to play bullishly in a pro-trending market tend to concentrate their attention on strong stocks (fundamentally and technically/chart) in strong sectors (relative performance to the SP500 and other sectors).
Traders should be highly selective of stocks in the “middle of the pack” sectors and be wary of trading stocks in the weakest sectors.
We’ll continue to follow broader trends in money flow across sectors and any updates to the current landscape.
By Corey Rosenbloom, CMT, Trader and Blogger, AfraidToTrade.com


