A stock or a market that has been trending lower becomes an easy target for short-sellers to take advantage of, writes Greg Capra of Pristine Capital Holdings, Inc.
Those who have been bullish and long also become tired of waiting for a turn around and also sell on each drop. However, at some point—most of the time—a floor does begin to form. This stock has been building a floor and last week it moved near the top of its range on heavy volume.
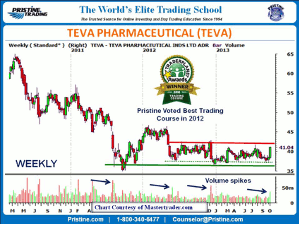
In the below chart of Teva Pharmaceutical (TEVA), a floor has been building for over a year now and while we cannot be certain of when it will break out of the range it has been building, I believe that it’s time to start keeping a closer eye on it. The $37.50 area has been were buyers starting to pick up shares of TEVA at the end of 2011. In 2012 and through 2013 that buying has continued in the same area with sellers taking control and pushing shares lower in the $42.00 area.
So why pay attention to TEVA now with it at the top of the range? Yes it could see the selling that it has in the past at the top of the range, and odds are that there will be selling. However, last week TEVA moved up to the top of the range from the bottom of it (one candle) and that happened on heavy volume. Moving to the top of a trading range in one candle on heavy volume, rather than moving to it in multiple candles on lower volume signals powerful buying in that time frame. There were volume spikes in the past that I have marked, but none of them were accompanied with a bullish wide range bar (+WRB). That type of price/volume action has historically has been followed by a continuation of that bullishness.
The above being said, the expectation under this scenario is for prices to consolidation near the top of the base, rather than decline back down to the bottom of the base. What that type of price action would communicate—should it occur—is that while sellers are trying to take control as they have in the past, buyers are willing to step up at these relatively high levels.
Technical analysis is not about looking at indicators to determine what prices are likely to do. It’s about looking at prices to determine what they are likely to do. Doesn’t that make sense? It should, but the majorities do exactly the opposite. Now, I did not side-step the indicator-based mythology when I began my study of technical analysis, but I did come to the realization early on that it was more nonsense than common sense.
By Greg Capra, President & CEO, Pristine Capital Holdings, Inc.


