The Vix is widely viewed as a way to measure market risk and forecast future stock price movements, and here Bill Luby of Vix and More answers the question of whether it was too low in 2013 and what’s in store for 2014.
There was a time when investors would generally fret about the VIX being “too high” and the resulting possibility that there was some sort of unseen threat to the financial markets that was not showing up on their radar. In the last few years, the situation has reversed and now I find investors expressing more concern about a low VIX more often than a high VIX. Yes, there are some (many, actually) who start to get anxious and fearful when the markets are not reflecting as much anxiety and fear as they think they should. For those who still think about the battle scars from 2008, this phenomenon seems to be a recurring issue.
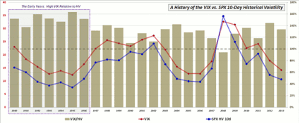
So…was the VIX too low in 2013? In order to answer this question, I am updating a chart I last presented in October 2012.
As the chart shows, both the (mean) VIX and 10-day historical volatility (HV) of the S&P 500 index (SPX) were are relatively low levels during 2013. More importantly, the VIX maintained an average premium of 34% to the 10-day HV of the SPX during the year, which is right in line with historical norms going back to 1990 of a premium of about 35%.

[source(s): CBOE, Yahoo]
Click to Enlarge
While I have used data provided by the CBOE going back to 1990 in calculating historical norms, I think it is worth noting that from 1990-1996, the VIX typically had a much higher premium relative to historical volatility in the SPX than it has in more recent years, so whereas the long-term VIX premium to HV stands at about 35%, the post-1996 average premium is closer to 26%. As a result, if you really need to drive home the point that the VIX was “too low” in 2013, you can always trot out the post-1996 data, but otherwise consider the VIX to be just about exactly where it should have been—at least in relation to historical volatility—during the past year.
Last but not least, the chart also illustrates that while the VIX and SPX HV do have a tendency to trend over the course of several years, the ratio of the two has a much more random movement and is therefore much more difficult to predict for 2014.
By Bill Luby of Vix and More


