
In this article, by the staff at ForexCrunch.com, the Chaikin Indicator is analyzed, including how it works and the opportune time to use it in your trading.
It is volatility that is ultimately responsible for a trader’s profits, since, if a market does not move, then there is no way to make money from it. It’s therefore vitally important to recognize those times when volatility is picking up as this offers the best opportunities to make trades.
As traders, we know that volatility often peaks at certain times, for example, when the European and US sessions crossover. However, it would be even better if there was an indicator that could show changes in volatility more scientifically, and the Chaikin volatility indicator aims to do just that.
Chaikin Volatility
Developed by Marc Chaikin, the Chaikin volatility indicator depicts volatility by calculating the difference between the high and low for each period or trading bar. It measures the difference between two moving averages of a volume-weighted accumulation distribution line.
It therefore differs from the simple Average True Range (ATR) indicator in that it does not account for gaps.
This aspect is good for short-term traders; gaps often occur overnight and can cause peaks in volatility to be downplayed.
The Chaikin indicator, however, shows precisely when the market starts to move. It’s default settings are left at 10,10.
The Chaikin in action
The great thing about the Chaikin indicator is that it often peaks at around the same time every single day. This means that is the perfect tool for helping to time your trades.
Take a look at the below chart for GBP/USD and you can see what I mean. The Chaikin indicator dips in the early morning Asian session before climbing higher as Europe and the US open for business. In fact, the indicator peaks between 14:00 and 16:00 GMT every day in the chart.
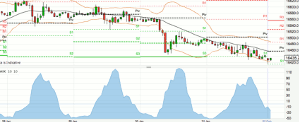
Click to Enlarge
What this means is that the Chaikin provides a great guide as to when to enter and close a position. As you can see, when the Chaikin is below 0, there is nothing much going on in the market. It’s during these times that you should refrain from trading and wait for the Chaikin to tell you when things are heating up. Chaikin is thus excellent for restricting the propensity to overtrade.
Once the Chaikin starts to move past 0, you can enter a trade, perhaps using another moving average crossover or pivot level as your guide. If you get a strong signal and the Chaikin has moved past 0 then it is a great chance to enter your trade.
Once the Chaikin peaks, you know that you can start to think about closing your trade. You also know that this will be between 14:00 and 16:00 GMT every day. Which makes sense, because European markets close around 16:30 GMT.
It is this regularity that can make the Chaikin indicator an essential tool for those who make one to two forex trades a day.
By the Staff at ForexCrunch.com


