
Similar in structure to Bollinger Bands or Donchian channels, Keltner channels are used to generate buy or sell signals, and here Corey Rosenbloom of AfraidToTrade.com backtests two simple Keltner channel trading strategies.
If price pushes above an upper Keltner channel—which is an indication of average true range and volatility—should we buy the breakout in hopes of an impulsive upward move or else “fade” the breakout by short-selling an overbought/extended swing?
A quick strategy backtest with simple parameters gives us the foundation to answer this question.
First, let’s define what generates a buy and how this strategy fits into the larger picture.
In the simple strategy test, I had the system “go long” (buy) when price breaks (and closes) above the upper Keltner channel (an ATR band indicator). This would mean that price has moved two times the daily average true range above the 20-day mean (average).
There’s two ways to conceptualize a price trading into and then above the upper Keltner channel:
One method defines this as a quantifiable “impulse” or sign of strength that should lead to continuation in the direction of the impulse (pro-trending or breakout strategy).
The other notes the movement as a sign of an “overextended” market that is in need of a pullback/retracement (fade or reversal strategy).
Thus method #1—the impulse—would buy a Keltner channel breakout in hopes of a continuation surge.
Method #2—the fade—would short-sell a break/close above the upper Keltner channel in hopes for a return to the average/mean.
So which is right and which is wrong?
It turns out “both” are correct depending on how long one holds the trade. Interesting. How can this be true?
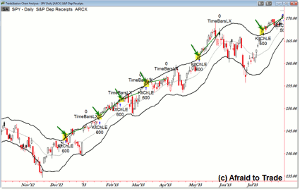
First, let’s take a look at a series of successful and failed Keltner channel breakout/impulse trades (which is what we’ll test in our system):
Click to Enlarge
The system buys the open of the next session after price closes above the upper Keltner channel.
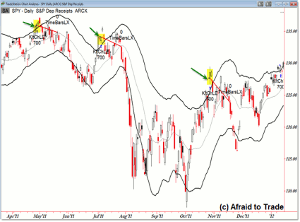
In the two charts, the system sold the position (profit or loss) after 14 days (bars).
From November 2012 to mid-2013, we see a series of six successful “breakout and impulse continuation” trades.
The opposite is true during most of 2011 where these same trades failed almost as soon as they triggered:
Click to Enlarge
2011 saw three “failed” breakout trades, or depending on your perspective, “successful” fade/reversal trades.
Remember, a close outside the Keltner channel can be see like a close outside the Bollinger Band, which uses standard deviation instead of average true range—price could be seen as “overbought” and due for an immediate pullback.
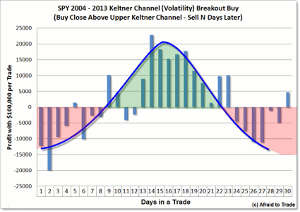
For this simple parameter test—without using stops—I wanted to see how time factored into the success or failure of the strategy.
I had the backtest “optimize” the exit as a time stop, meaning “run the same test 30 times on the same data but each time, change how long you hold a position/exit.”
Starting with one day, I wanted to test how time—length of time holding an open trade that triggered—made a difference in net profit or loss.
Here’s the graph of the repeated strategy tests and outcomes (as a factor of Net Profit):
Click to Enlarge
Assuming one trade $100,000 per position for each trade (buying the SPY on a close above the upper Keltner channel), we exit “N” number of days later to see how time in a trade altered net profitability.
NEXT PAGE: Trade Strength or Fade Strength?
|pagebreak|We see an interesting – and stable – distribution based on how long an open trade was held:
From one day to nine days, the system was net negative, losing money.
The system was also net negative from 24 to 30 days in a trade.
Finally, the system was net positive from day nine and 10 then from 13 to 23 days in an open trade.
What’s the quick take-away from the simple backtest data?
Again, both arguments—the “trade strength” and “fade strength” arguments were “correct” but it depended on how long one held each trade during the 10-year backtest period (from 2004 to 2013 using the SPY daily chart with $100,000 per trade).
Trend following or “impulse” traders were correct that breakouts were—in general—signs of additional impulse (continued upward price action) yet to come, but only if they gave the trade enough time to work.
The system returned that 14 days – roughly two weeks – tested out best for the simple parameters.
More important than a single optimized variable, we see the positive distribution around the 16-day period, meaning that the system tested best holding an open position from 14 to 19 days.
There was a diminishing return on length of time in a trade; interestingly, holding a trade beyond 23 days resulted in similar negative performance as holding one from one to nine days.
For the “fade/reversal” traders, what’s bad for this strategy test is good for them. In other words, if one lost money buying a Keltner breakout (held from one to nine days), this would have returned a positive result for fade/reversal traders.
Fade/reversal traders would have lost money holding a position from nine to 23 days.
This does suggest that there is a short-term reversal that tends to occur as soon as price breaks above an upper Keltner channel high, but over time (and over many trades), the winning trades outweigh the losing trades IF a trader holds a position long enough to capture the impulsive continuation move higher.
It also underscores the point that most breakout trading strategies fail if one does not give a trade “room to run,” or enough time to capture the large gains from a smaller number of trades that overtake the smaller losses from a larger number of trades.
Keep in mind this test did not use stop-losses or any other optimization method—it just tested time in a trade.
While there are plenty of other tweaks to this simple strategy we can use for additional tests, this most basic backtest gives a baseline for assessing performance.
Here’s the full metrics for those bold enough to study the raw data for additional insights from this simple test:
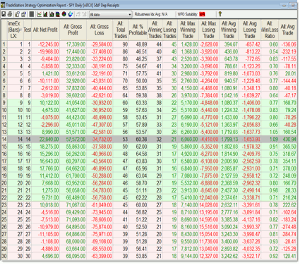
Click to Enlarge
Interesting facts from the data:
Gross profit, maximum winning trade, maximum losing trade, average winning trade, and average losing trade ALL increased linearly as a function of time in a trade (this makes perfect sense).
As time in a trade increased, the number of trades taken decreased linearly, as did the number of winning and losing trades (which also makes sense).
The percent of profitable trades had a similar “bell curve” distribution to the net profit. This was also true for win loss ratio along with average trade.
Again, this was just a simple/quick backtest to lay groundwork for answering a question about whether it is better to “go with” a breakout/impulse or “fade/fight” it. This isn’t meant to be traded as a strategy—not without refinement and many more backtests conducted.
By Corey Rosen bloom, CMT, Trader and Blogger, AfraidToTrade.com


