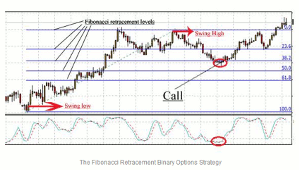
In this article, the staff at FXEmpire.com discusses two instances in which trading with the Fibonacci retracement tool favors the trader.
The Fibonacci retracement tool is quite possibly the least understood and most intimidating—at least for new traders—indicators, and it is exactly what we’re going to use for trade analysis through this strategy, which is aimed at the call/put contracts as well as the Touch side of the Touch/No Touch trade.
Retracements are some of the most prominent components of any uptrend, regardless of its strength and it therefore makes perfect sense to build a trading strategy around this phenomenon.
Why are retracements such inevitable components of all financial markets though? Simple: the nature of the market says that those who jumped aboard a given asset early will look to stop and take some profits after a while, thus inducing a temporary reversal of the dominant trend. Institutional traders are usually the ones to kick-start the profit taking, followed by the rest of the traders.
Because this strategy is such a trend-dependent one, the time frame used for it calls for daily charts. The reasoning behind it is simple: smaller time frame charts, like hourly ones, are rendered irrelevant because of all the noise occurring through the day. Daily charts offer a bird’s-eye view of the market situation, which—from the point of view of trendspotting—is exactly what’s required.
What’s the actual strategy about though? The goal is to identify the point where a retracement move ends, by using the Fibonacci retracement tool. The asset-price will bounce back to the dominant trend at one of the Fibonacci levels, defined by the retracement tool, the only remaining question is: which of these levels are we talking about?
The Fibonacci retracement tool identifies five critical retracement levels, at which a trend-reversal is likely. These are situated at 23.6%, 38.2%, 50%, 61.8%, and 100% of the retracement levels.
The Fibonacci retracement tool is put into application by first tracing a line linking the lowest price-point of the time frame with the highest one (these are also known as the swing high and the swing low). Once this has been done, defining the area of interest on the chart, the five Fibonacci levels will appear on the chart as horizontal lines, at the above said percentage-points.
These retracement levels are the possible targets for the Touch component of the Touch/No Touch contract. Statistically, most retracements break the first two Fibonacci levels (those at 23.6% and 38.2%) without problems, so the strike price for the Touch trade should be placed on the 38.2% mark, but only after the retracement has breached the 23.6% level. The expiry on this trade—which is the straightforward way to trade the Touch/No Touch contract with this strategy—should be set to ten days. Don’t let the seemingly daunting expiry scare you: it will, in fact, increase the chances of success for the trade.
The second method to trade the Touch/No Touch is a bit more complicated and it calls upon the stochastic oscillator for help. It is based on catching the resumption of the previously dominant trend. The stochastic oscillator is needed to confirm the end of the retracement period. Once this step has been cleared, traders need to set the previous Fibonacci level as the strike price for the Touch trade.
If the retracement ends on the 38.2% Fibonacci level as on the attached chart, the strike price should be set to the 23.6% level.
NEXT PAGE: A Tad Bit Different Trade
|pagebreak|A word of caution: this strategy is unfit for the trading of the No Touch component of the Touch/No Touch contract.
The Call/Put trade is a tad different. This approach is about putting the Call/Put trade (whichever is needed based on the direction of the dominant trend), at the point where the retracement ends and the original trend resumes. This is obviously at one of the Fibonacci levels, but one will need the help of the stochastic oscillator to determine exactly which one. The stochastic oscillator will indicate a situation when an asset is oversold having retraced from an uptrend, at one of the Fibonacci levels. That level is where the retracement is likely to end.
The Call trade should be purchased on the Fibonacci level on which the stochastic oscillator crosses at an oversold level.
On the chart used for illustration, this level is obviously the 38.2% one, which is where the Call trade should be purchased.
The expiry time on this trade should be almost as generous as on the above described Touch trade. In this instance, it should be set to about seven days, to give the asset price plenty of time to move in the right direction (again: we’re using the daily chart for this).
Unlike the No Touch part of the Touch/No Touch contract, the Put component of the trade can be used too with this strategy. In this case, everything works pretty much by analogy. Where the lines of the stochastic oscillator cross an overbought situation on the Fibonacci retracement level, a Put trade should be purchased, since that point marks the end of the retracement and the resumption of the bearish trend.
As with any binary options trading strategy, it is recommended that you put this one to the test—preferably several times—on a demo account, so you risk no real money on it. Once you feel comfortable with it and you feel you can aim for actual results, throw this puppy into deep water and take it for a spin. While the above presentation was one disregarding several complex, probability-linked aspects of the strategy for the sake of simplicity, the probabilities and the expected value involved all work—at least, theoretically—in favor of the trader.
By the Staff at FXEmpire.com


