Given all the technological advancements over the years, it seems that nearly every facet of trading and investing has gone electronic, but has the way money is made buying and selling in the markets really changed? Sam Seiden, of Online Trading Academy, explains why he thinks not.
I remember my days on the trading floor of the Chicago Mercantile Exchange. My job was to facilitate institutional order flow. Each day I would take orders from banks, institutions, money managers, and so on and facilitate the execution of those orders into the various markets. Having the real buy and sell orders from the institutions in front of me, you could clearly see where the strongest demand and supply was in the markets. If I wanted to know where the S&P was going to stop falling and turn higher, all I had to do was look in front of me and see where the largest amount of buy orders were below current price indicating the markets’ real demand and vice versa for supply. Each day, price just moved from where the significant buy orders were (demand) to the price level where significant sell orders were (supply).
Today, we don’t have much in the way of paper orders anymore, like I dealt with on the trading floor. Just about everything has gone electronic. However, from my 30,000 foot view of how people understand, and trade, and invest in the markets today, it is so clear what has happened over the years. What is such a simple and obvious supply and demand equation has turned into complex math driven strategies, endless combinations of indicators, PhD level economics, and much more due to the technology boom of the past decade. While technology has advanced so much and change does happen almost daily, how we make money buying and selling in the markets has not changed one bit. What caused price to turn and move many years ago is exactly what causes price to turn and move today. It is still 100% the simple supply and demand equation it always has been and always will be.
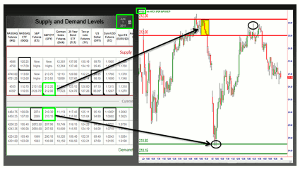
OTA Supply/Demand Grid, June 2, 2015: SPY (S&P 500 ETF)
Therefore, it is our job to use price charts to figure out where those orders are, the demand and supply. At Online Trading Academy, we look for the picture that represents demand and supply as that is where prices turn, which is the origin of any market move, large and small. To do this, we use a checklist called “Odds Enhancers.” Above is the Supply/Demand grid from our Mastermind Community, one of the many services for our Mastermind members each day. Notice two weeks ago, the grid identified where banks were buying and selling the S&P which allowed our Mastermind members to buy and sell there also. Let’s focus on the supply level (yellow area). Let me share some Odds Enhancers with you here that helped identify these key levels. I will do this in hopes of improving your active income and passive income trading and investing results.
1) How did price leave the level?
The stronger the move in price away from an area, the more out of balance supply and demand is at the area. This is what causes the strong turn and move in price in a market, a big supply and demand imbalance. Notice the strong decline away from that level suggesting a large supply and demand imbalance. This is why prices turned as predicted when price revisited that level (circled area).
2) How much time did price spend at the level?
At price levels where supply and demand are most out of balance, you always get the least amount of trading activity. Therefore, the less time price spends at a level, the more out of balance supply and demand is at the level. So, don’t focus on where price traded at, but instead become more interested in levels price could not trade at or had trouble trading at.
3) First retracement/Fresh level
Most trading books tell us when we are buying at support or selling at resistance, don’t take the first retracement. Instead, let the level be tested a few times to make sure it’s strong. I would suggest the opposite with this Odds Enhancer. We want to enter the position on the first retracement because it is at that point that supply or demand is strongest. With each successive retracement in price, the level is getting weaker, not stronger like the trading books suggest. Remember, it’s all about the buy and sell orders.
There are more Odds Enhancers of course, such as profit zone, which is key but these are some that allow us to determine where the significant demand and supply was in the S&P (and any market). Seeing where these orders are on the price chart is the key to everything we do. It is how we are able to attain the lowest risk, highest reward, and highest probability entry (and exit) in any market and time frame. The hardest part is realizing that how and why prices turn and move in markets has never changed, no matter how far technology advances. Faster and better number crunching will never be more important than knowing where the smart money (banks and financial institutions) are buying and selling. Keeping things simple is the single greatest challenge for the average person from my experience, but at the same time, it is also the single biggest advantage if you can do it. Can you?
By Sam Seiden, Chief Education, Products, and Services Officer, Online Trading Academy


