The market may be close to a bottom, and next week’s action will likely either confirm that or send more investors running for the hills. Still, there should be attractive buys out there, writes MoneyShow.com senior editor Tom Aspray.
Last Tuesday’s headline in The Wall Street Journal, “Market Nears Bear Territory,” was enough to spur further selling in an already weak market.
The S&P 500 and Dow Industrials both dropped well below the August lows before staging an impressive late-day reversal. For a change, it was encouraging news from the Eurozone that helped spur the rally, but there was also likely some serious short covering.
As I noted in late September, there seemed to be a consensus building that we either were definitely going back into recession mode or were already there. A consensus in the financial markets is not always wrong, but the high degree of negative sentiment suggested joining the “gloom and doom” camp might not be the right idea.
The monthly jobs report changed a few minds, with some analysts undergoing a complete reversal of their prior opinion. This is one of the many reasons I do not place much weight on economic reports, especially on any one data point. Stocks rallied early Friday, but could not hold the gains into the close.
The primary question is whether last week’s action changes the outlook for the rest of the month or the rest of the year. In my view, it does, and here’s why…
There was some clear improvement in the technical picture last week. While I have not yet seen the signs to confirm that the market has bottomed, there is evidence that the worst of the selling is likely over.
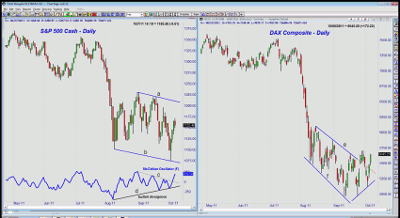
The daily chart of the S&P 500 shows that it did make lower lows last week (line b) and the rally has just taken it back to first strong resistance above 1,175. There is further resistance at 1,180 and then more important levels at 1,200 to 1,210 (line a).
Most encouraging was the fact that the NYSE McClellan oscillator, a short-term A/D indicator, formed significantly higher lows (line d).
This is known as a bullish divergence, and suggests that even though there were signs of panic selling last week, it was not as heavy as it was in August. It is also a good sign that the short-term downtrend (line c) has been broken.
Over the past few weeks, many on Wall Street have been most concerned about the contagion spreading from Europe to the US. In fact, positive developments regarding European banks last Tuesday were credited with fueling the rally. Clearly things have not been resolved yet, as one rating agency downgraded both Italian and Spanish debt on Friday afternoon.
Germany is the strongest Euro member, and despite the pessimism and selling early last week, the German Dax is holding well above the lows from early September. Even though the downward trading channel (line e) has been broken, there are no strong signs that a major bottom has been formed. The Dax does appear to have stabilized, which is a positive sign.
The European Central Bank left rates unchanged last week, despite an unexpectedly sharp increase in inflation. There were also increased concerns over the emerging markets, as some of the numbers from China suggested its economy may not have turned the corner.
In addition to the monthly jobs report last week, the economic numbers were a bit better than most expected, and this week the economic calendar is light. On Tuesday, we get the minutes from the FOMC meeting, and international trade numbers and jobless claims follow on Thursday.
Finally, on Friday, we get the retail-sales data, import and export prices, consumer sentiment and business inventories.
We are entering a period of seasonal strength for the retail stocks, and I discussed several of the retail apparel stocks last week. Therefore, I would not be surprised if the retail-sales numbers were stronger than most expect.
NEXT: What to Watch
|pagebreak|WHAT TO WATCH
Depending on what market average you are looking at, you certainly get a different picture of the US stock market.
If you are looking at the Nasdaq-100, things look pretty good, while the Russell 2000 does not look so hot. Therefore getting a consensus view by looking at all the key groups is even more important in this tricky environment.
On the drop last week, the strongest stocks held well above the August lows, while others violated their lows by a slight margin before reversing to the upside. This action is consistent with a sustainable bottom, as the new lows cleaned out the stops and left many on the sidelines who are likely to eventually buy again in frustration.
Sentiment remains quite negative, with more than 45% of financial newsletters bearish as of October 5, according to Investors Intelligence. Individual investors became a bit less bearish last week, according to the AAII survey, as only 45.7% were bearish as opposed to over 48% two weeks ago.
This alone does not mean that stocks have to bottom, but if the A/D lines complete their bottom formations, it would create an environment for a strong rally.
S&P 500
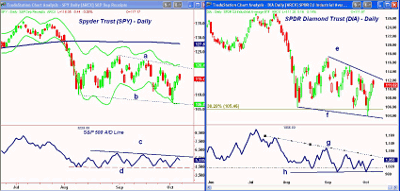
The Spyder Trust (SPY) dropped convincingly below the August lows of $110.27. Last week’s low was $107.43, which was just above the target from the flag formation at $106.50. The daily Starc- band was tested early last Tuesday, before prices turned higher.
The rally appears to have stalled in the $117 area. There is further resistance at $118 and the sharply declining 50-day moving average. The SPY needs to surpass the resistance between $119.50 and $122 to make the bears nervous.
The S&P 500 A/D is still locked in a trading range (lines c and d), but it is encouraging that it did not violate the recent lows, even though SPY did. A breakout above resistance (line c) will be a strong indication that the worst of the selling is over.
There is next support at $113.50 to $114, with stronger levels in the $112 to $112.40 area.
Dow Industrials
The Spyder Diamonds Trust (DIA) just tested the declining 50-day MA early Friday before turning lower. Additional resistance stands at $113.45, and a daily close above $115.26 would be positive.
The Dow Industrials A/D held above the September lows (line h) last week, even though DIA made lower lows. The A/D line is very close to the downtrend (line g), and a move through it would be positive.
If the A/D line does breakout to the upside, we would typically get a one- or two-day pullback, which should be a good buying opportunity.
There is initial support now for DIA at in the $109 area. A daily close below $108 would weaken the short-term outlook.
If the market is in the process of bottoming out, I would expect many of the stocks in the Dow Industrials to do especially well, as in uncertain times the large-cap and dividend-paying stocks are generally less volatile and therefore attractive.
Some of the stocks in the Dow Industrials that were oversold on the basis of their monthly Starc- band analysis are discussed in “The Most Oversold Dow Stocks.”
NEXT: Nasdaq, Sector Focus, and Tom’s Outlook
|pagebreak|Nasdaq-100
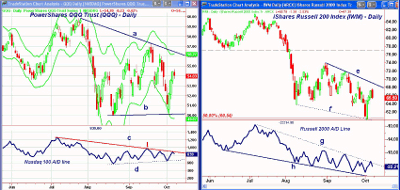
The PowerShares QQQ Trust (QQQ) hit a low of $50.10 last Tuesday, holding above the prior lows at $49.99 and $49.93, before closing the day at $52.19.
The resistance at $54.50 was hit early Friday, which is just below the short-term 61.8% Fibonacci resistance. There is additional resistance at $55.43 to $56.20. A close above this resistance would be positive. The daily downtrend (line a) and the daily Starc+ band are now at $56.37.
The Nasdaq-100 A/D line tested its downtrend (line c) on Friday, but needs to close above it to complete the bottom formation. A close in the A/D line above the September 20 high (see arrow) would be quite bullish.
The fact that the A/D line has formed higher lows (line d) also suggests there were fewer sellers at the recent lows.
I will be looking at some specific technology stocks next week.
Russell 2000
The iShares Russell 2000 Index Fund (IWM) dropped below the major 50% support at $60.54 (line f) on Tuesday, before those on the short side ran for cover. The initial resistance at $68 was hit, as IWM was up over 13% from the week’s lows. The downtrend (line e) is in the $69.50 area.
The Russell 2000 A/D line, after topping out in April when it failed to confirm the price action, has made a series of lower lows (line h). The steep downtrend (line g) was broken on Friday, but I need to see a pattern of higher lows and higher highs before I can conclude it has bottomed.
There is support for IWM in the $64 to $65 area.
Sector Focus
As I discussed in detail earlier today, there are only three major sectors that are positive for the year, though there are two other that have done better than the S&P 500.
The RS analysis suggests that these sectors should continue to outperform the S&P 500 as we head into the end of the year. So far, there are no signs yet of a turn in the energy, materials, industrials, or financials even though all rallied sharply last week
NEXT: Oil, Metals, and Tom’s Outlook
|pagebreak|Oil
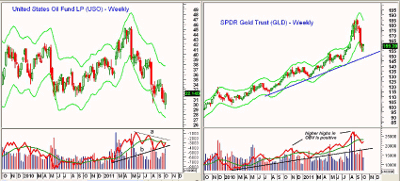
Crude oil also made new lows early in the week before rebounding. The weekly chart of the United States Oil Fund (USO) shows the impressive reversal.
The weekly on-balance volume (OBV) shows a short-term positive divergence, as it held support (line b) last week. A move through the downtrend would be positive.
A close above the weekly high in the $35 area should complete the bottom formation, and suggest a rally to the $37.50 area.
Precious Metals
The SPDR Gold Trust (GLD) has traded below the weekly Starc- bands for the past two weeks, but did manage to close higher last week. This suggests it may be ready to rally, as many of the weak long positions were likely sold on the recent plunge.
There is initial resistance now at $165, with stronger levels at $170, which is the 50% Fibonacci retracement.
The weekly OBV has turned up, but is still below its WMA. Typically, we should see a good rebound in gold and then another pullback before the corrective pattern is completed.
The iShares Silver Trust (SLV) has been trying to stabilize in the $28 area. The recent plunge has likely scared many away from this market for a long time. After the reversal in May, the weak rebound had all the markings of a bear-market rally, so the last drop was not a surprise.
The Week Ahead
Though there has been some improvement in my outlook for the stock market, it is too early in my opinion to react. This week’s action is likely to be quite important, as a further shallow decline followed by a strong "up" day will add evidence to the view that the decline from the April highs is over.
Last week’s decline was the good buying opportunity I have been looking for, and it will now be important that last week’s lows are not seriously broken. The A/D numbers should continue to give us the best insight on whether a stronger rally is underway.
Hopefully you were not panicked out of your gold positions near the lows. While the recent lows could be slightly broken, another sharp leg to the downside does not look likely.
Don’t miss Tom’s latest Trading Lesson, Accurately Analyzing RSI Divergences


