MoneyShow's Tom Aspray isn't just talking about the elevated risk and diminishing yields on lower-grade bonds...these lofty market levels call for investors to consider quality everywhere they invest, and to avoid chasing prices right into a likely correction. He shares a number of high-quality plays for these market conditions here.
The stock market managed only slight gains for the week, but it was a positive sign that the S&P 500 surpassed its September 2012 highs. A few of those who have been bearish on stocks since before Christmas have changed their tune after last week's action.
Nevertheless, there are still quite a few who are not optimistic on stocks or the economy over the near term. A panel of 13 bank economists forecast last week that GDP would just grow at a 1.3% rate in the first quarter and 2% for the year. This is slightly more pessimistic than the Federal Reserve's 2.3% estimate.
Last week's earnings overall were better than expected, as Morgan Stanley (MS) was up over 5% last Friday after reporting a nice profit. This was quite a change from the prior year's fourth-quarter loss. On the other hand, Intel (INTC) disappointed the market, and it lost over 6% Friday.
As investors start the New Year, they often pay more attention to what they are doing with their portfolios. As I argued in "5 Rules for Success in 2013," investors should not blindly follow the latest list of top stocks for 2013, as they often encourage bad investing habits.
As I discussed last week, interest rates moved higher in the first few days of 2013, but have since been drifting lower. Though the short-term trend is still toward higher rates, the long-term downtrend remains intact. This is making it hard for investors, as those who recently purchased TIPs or inflation-protected T-Notes are currently set to get a negative return.
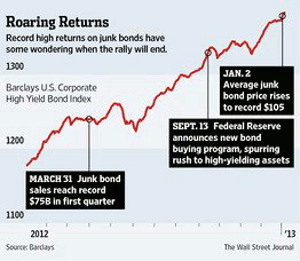
Many investors are wondering whether 2013 will be another stellar year for junk bonds, which were up 15% for 2012. The chart from The Wall Street Journal shows the dramatic rise of the Barclays US Corporate High Yield Bond Index in 2012, and the further gains in early 2013.
The fact that $75 billion of junk bonds were sold in the first quarter of 2012 is pretty impressive, but many are alarmed that a large number of junk bonds are trading well over par. For the first time ever, the average yield has fallen below 6%, after spiking to 10% in late 2011.
Given the high price and lower yield, many of these bonds are becoming callable at prices below their current levels. The consensus view is that junk bonds are likely to return 6% to 8% in 2013. I think they are to risky currently. However, a major pullback in price may create an opportunity later in the year.
Even though stocks had impressive gains in 2012 and early 2013, most investors are still not interested. Recent comparisons of how large-cap stock funds have done versus the S&P is not likely not to be a selling point. Goldman Sachs reported that 65% of these funds did worse in 2012 than the S&P 500.
Of course, my philosophy is to identify the strongest sectors, and then the best stocks in those sectors. Once there are signs that the sector is no longer outperforming the S&P 500, I raise cash or start moving into a sector that is stronger than the S&P 500.
Two of the sectors with the best relative performance for most of 2012, the Select Sector SPDR Financial (XLE) and the Select Sector SPDR Consumer Discretionary (XLY) were up 28.4% and 23.6% respectively in 2012. This was much better than the S&P 500.
NEXT: Global Markets and What to Watch
|pagebreak|I also continue to like the overseas markets in 2013, as there were signs last fall that they were starting to lead the US markets.
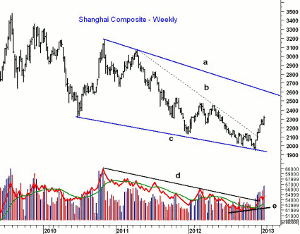
The weekly chart of the Shanghai Composite shows that it broke through its downtrend (line a) in early December. The economic news has been improving over the past few months, consistent with a turnaround in its economy.
The on-balance volume (OBV) has also turned positive, as it formed a bullish divergence (line e) at the recent lows and then moved through its downtrend (line d). The divergence was a sign that as the Composite moved lower there were fewer sellers. The longer-term downtrend (line a) is now at 2,550, which is over 10% above current levels.
Two China ETFs were recommended last November, and last Friday I discussed two other country ETFs that I think will benefit from China's turnaround.
Last week's data on new home construction reflected the highest rate of construction since mid-2008. Retail sales were also better than expected, suggesting the consumer was willing to spend more than most thought in December. This optimism was dampened a bit last Friday, when the preliminary reading on Consumer Sentiment declined slightly after December's big drop.
The Empire State Manufacturing and the Philadelphia Fed Survey both reflected softness in the manufacturing sector, which is still a concern. On the other hand, the number of unemployment claims dropped to their lowest level since early 2008. The stock market responded strongly to this report.
In the week ahead, this Tuesday we get existing home sales, as the markets will be closed Monday for the Martin Luther King holiday. Then on Thursday, we get the weekly jobless claims, followed on Friday by new home sales.
What to Watch
For the past two weeks, the majority of the
major averages have made little upside progress, though the market internals and
some stocks have done much better.
The bias is clearly to the upside, even though much of Wall Street ponders the impact of the debt ceiling and voices their concerns over the stock market. Comments from House Republicans late last week suggests they may not force a showdown right now over the debt ceiling
The continued slide in Apple (AAPL) stock has not helped, as its break of the $500 level stopped us out and increased the already high level of negative sentiment. While the tech sector still tries to find a bottom, quite a few sectors continue to make new highs.
The market seems quite resilient as once again last Friday's early losses were met by buying as the market closed higher. I still think the S&P 500 is likely to challenge the 1,500 to 1,520 area over the next few weeks. Before a short-term top is complete, we would normally expect to see one sharp pullback and then a rally above the prior highs.
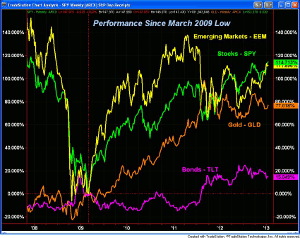
You may find a surprise or two in this performance chart of four key markets since the stock market low in March 2009. The Spyder Trust (SPY) and the iShares MSCI Emerging Markets Index (EEM) are about even, gaining 114% and 111% respectively. In April 2011, EEM was up 138% before it dropped sharply. The percentage chart for gold still shows an uptrend, but some are likely disappointed by the 77% gain.
The action was mixed in the sentiment numbers last week. While individual investors became a little less bullish, the financial newsletter writers moved up slightly, to 53.2% bullish with just 22.3% bearish. These numbers are still not at danger levels, but are getting closer.
NEXT: Stocks and Tom's Outlook
|pagebreak|Though there are still some stocks that are just completing bottom formations, others are well above support, and some are close to their weekly Starc+ bands.
As I noted in my recent trading lesson, the Spyder Trust (SPY) had two sharp double-digit rallies in 2012, but each was followed by almost a double-digit correction. I see no reason to think that 2013 will be that much different, so focusing on risk will be essential.
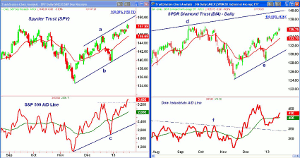
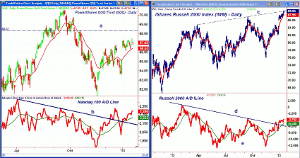
Last Friday's review of the NYSE A/D line (see chart) showed that it was rising sharply, which often means a rally that can last quite a bit longer, as was the case in early 2012.
S&P 500
The Spyder Trust (SPY)
pushed up to a high of $148.42 last Thursday after trading in a range for the
prior four days. This is similar to what happened from January 3-9. Therefore,
we may consolidate for a few days before SPY pushes higher.
This week, the trend line resistance will be near $150, with the 100% or equality target at $150.70. The quarterly R1 resistance stands at $150.58.
The S&P 500 Advance/Decline pushed above the prior highs last week, which is bullish. It is well above its sharply rising WMA.
There is initial support at $146 to $146.50, with further levels at $145. The quarterly pivot is at $142.64, which also corresponds to the daily uptrend, (line b).
Dow Industrials
The high in the SPDR Diamond
Trust (DIA)
last week was $136.19, which was just below the September high of $136.48. The
100% target and the quarterly R! resistance are in the $138 to $138.80 area. The
Starc+ band is at $139.20 this week.
The Dow Industrials A/D line broke through resistance (line f) in early December. The A/D line moved back above its WMA last week, but is still below its prior peak, as Intel (INTC) and Boeing (BA) are holding it back.
There is support now at $134 to $134.40, with the rising 20-day EMA now at $133.69. The quarterly pivot waits at $131.46.
Nasdaq-100
The PowerShares QQQ Trust (QQQ)
made marginal new highs last week at $67.48, which is still below the strong
resistance at $68.30 (line a) and the early October highs of $69.80.
The Nasdaq-100 A/D line rebounded after plunging in late December, but has not yet surpassed the December highs. The break of the downtrend (line b) was a positive sign.
The rising 20-day EMA is now at $66.43, with additional support at $65.13, which was the closing level of 2012.
Russell 2000
The iShares Russell 2000
Index (IWM)
overcame the September highs at $86.96 in early January and continued to make
higher highs last week, reaching the trend line resistance (line c).
Both the equality target calculated from the November low to the December high and the quarterly R1 are in $90.45 to $90.60 area.
The Russell 2000 A/D line did make new rally highs, but is still slightly below the September highs and therefore lagging the price action.
There is first support for IWM at the gap between $84.43 and $86.04, with further chart support in the $83.50 area.
NEXT: Sector Focus, Commodities, and Tom's Outlook
|pagebreak|Sector Focus
The iShares Dow Jones
Transportation (IYT)
had another good week, gaining almost 1.7% and closing just below the next
resistance at $101.60, which was the 2011 high.
There were several standout sectors last week, as the Select Sector SPDR Energy (XLE) and Select Sector SPDR Consumer Discretionary (XLY) both gained over 2%.
Last week's article "Will This Be February's Hot Sector?" focused on crude oil and its seasonal tendency to bottom in late January and early February. Currently, XLE is overextended, and investors should wait for a sharp pullback to buy. I do like several of the individual energy stocks.
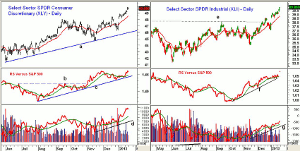
The Select Sector SPDR Consumer Discretionary (XLY) shows a strong uptrend from the late December low, as it continues to make new highs. The quarterly R1 at $49.70 has been reached, with the R2 at $51.02.
The relative performance is now back to the late November highs and is well above its rising WMA. The RS line broke through its resistance (line c) in November. The OBV looks even stronger, showing a series of higher highs, and is well above good support (line d). The 20-day EMA is at $48.55.
The Select Sector SPDR Industrials (XLI) was also strong last week, up about 1.9%. It has accelerated to the upside in early 2013. The 2011 highs were overcome, and the 2007 highs are close at $41.99. It was one of my favorite sectors in early December, after breaking through resistance (line e).
The relative performance shows a series of higher highs, but may be losing some upside momentum. The on-balance volume (OBV) does look stronger, as it completed its base toward the end of November and has been rising steadily since.
The Select Sector SPDR Health Care (XLV) made further new highs last week, but was up only 0.8% at the close. The Select Sector SPDR Financial (XLF) was down slightly, while the Select Sector SPDR Technology (XLK) lost 1%.
Crude Oil
The March crude oil contract gained $1.50 per
barrel last week, and continues to act well and stronger than the energy sector.
The next major resistance is in the $100 area.
Precious Metals
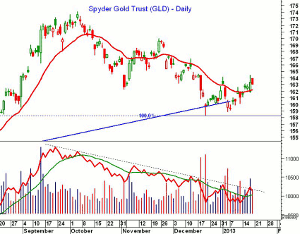
The SPDR Gold Trust (GLD)
gained $2 last week and closed back above its 20-day EMA. In December, it hit a
low of $158.39, which corresponded to the 61.8% Fibonacci support level from the
June 2012 high as well as the equality target (100%) using the decline from the
October highs to the November lows.
This could be an important low, but the daily technical studies have not yet given new buy signals. For example, the OBV did make lower lows, and has just barely broken its downtrend (line a). Therefore, one more new low is still possible, but I will be watching closely.
The Global X Silver Mines ETF (SIL) has started to turn lower, and closed weak. We are using a tight stop on longs, and it needs to close above the quarterly pivot at $23.62 to complete its bottom.
The Week Ahead
There isn't really any change in our
outlook this week, but if the Spyder Trust (SPY)
moves convincingly above $150, I would turn a bit more cautious unless we see
some upward acceleration.. If there is a temporary plan on the debt ceiling, the
rally could pick up steam.
In the update to the Charts in Play Portfolio last week, I recommended taking some partial profits on some positions at higher levels. I would suggest that if you have some nice double-digit gains in some positions, consider selling part of your position on strength, as a correction is likely in the next month or so.
I recommended several new stocks and ETFs last week and have several open orders. I continue to favor stocks close to support, where the risk can be kept reasonably low.
Don't forget to read Tom's latest Trading Lesson, 5 Rules for Success in 2013.
