Seasonal analysis has been gaining popularity in recent years, and MoneyShow’s Tom Aspray takes a look at the January Barometer to see whether its premise will hold true this year.
As the S&P 500 closed 3.5% lower in January, the focus is likely to be on the January Barometer. The phenomenon was first discussed in 1972 by Yale Hirsch, founder of the Stock Trader’s Almanac. It simply states “that as the S&P 500 goes in January, so goes the year.“
According to CNBC (see data), it has been right in 62 of the past 85 years or 73% of the time and over the past 35 years it has been right 71% of the time. Using the S&P 500 data, it has had five misses since 2000. I think these patterns, like the seasonal data, needs to be in agreement with the technical studies like the market internals. Therefore I wondered whether the NYSE Advance/Decline, the most reliable stock market indicator, might have given one advance warning of these past misses.
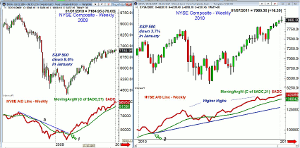
Let’s look at 2009 first as most are aware the NYSE Composite made its final low on March 6 and both the weekly and daily A/D lines also made new lows. By the end of the month, the downtrend in the weekly A/D line from the 2008 highs was broken (line a). The A/D line also moved above its WMA (point 1), and as I noted at the time, the technology sector looked even better than the S&P 500 or the NYSE.
Even though the S&P 500 was down 8.6% in January of 2009, the improvement in the market internals and the severity of the bear market shifted the odds in favor of a positive year by the end of April.
Since the 2009 lows, the A/D line has been making a series of new highs with prices, keeping the outlook for stocks positive. They did diverge for several months in 2013, which was resolved by the new high in January. At a bull market top like October 2007 (see chart), the A/D line had been diverging for over five months as it warned of a market top.
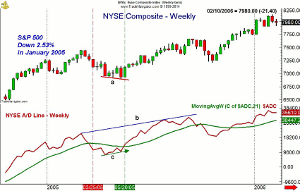
In January 2010, the S&P 500 was down 3.7% but both prices and the A/D line made new highs before stocks turned lower. This signaled that the major trend was positive and a correction should be a buying opportunity. The S&P 500 corrected 9.2% from high to low and bottomed in early February. The chart shows that the weekly A/D tested its WMA on the correction.
In April 2010, the A/D line made another new high as it did again in November as the S&P 500 finished the year up 12.78%.
In January of 2003, the S&P 500 dropped 2.74%. In 2002 and 2003, the NYSE Composite dropped down to the 4400-4428 area on three occasions forming a complex bottom. The third low came in the middle of March 2003 and the NYSE held above the October low.
The A/D line was acting much stronger than prices in early 2003, as it was making higher lows, line d. The bottom formation in the A/D line was confirmed in early April (line 1) as the downtrend in the A/D line, line c, was broken. It took the NYSE Composite four more weeks to break through its corresponding resistance (line a). This was a strong bottom formation and the S&P 500 ended up 26.38% for the year.
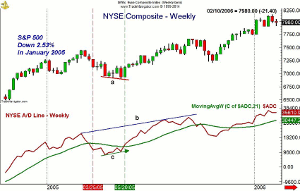
In January 2005, the S&P 500 was down 2.53% but the A/D line had kept its pattern of higher highs since the spring of 2003. It had just made a new high at the end of 2004 before the correction in January 2005. By early March, the NYSE Composite, S&P 500, and the NYSE A/D line were again making new weekly highs.
The NYSE A/D line then dropped below its WMA on March 25 and the following correction lasted ten weeks as the S&P 500 lost 7.2%. As the NYSE Composite was bottoming out, the A/D line formed a bullish divergence, line c. By May 20, the A/D line was again back above its WMA.
In June, the A/D line made another new high as it did in the fall, which kept the major trend positive for stocks even though the S&P 500 was up only 3% for the year.
So why is this relevant in 2014? Since the weekly A/D line made a new high in January, I expect that once this correction runs its course, the market will again move higher and exceed the January highs.
The A/D line analysis gives the S&P 500 a positive bias for the year as long as no significant bearish divergences are formed later in the year. In terms of parallels, the A/D line in 2014 looks the most like 2010. I would expect the S&P 500 to close the year higher, but as I expected at the end of 2013, it is likely be a bumpy ride.
Once again, it was China that lit the fuse for the current market decline. It has played this role several times since the bull market started, though it has spread further this time. The sharp increase in rates by several emerging market countries reflects a high level of fear. This drastic action will likely attract investors again once the markets calm down. Remember, there were some brave investors who were buying the National Bank of Greece stock for $1 in early 2013 and it hit a high of $6.85 just a few months later.
NEXT PAGE: What to Watch
|pagebreak|The market is already starting to worry many investors and weaker-than-expected economic data is helping to reverse the too-high level of bullish sentiment. Both the New Home Sales and Pending Home Sales data was worse than expected while the S&P Case-Shiller HPI reflected that prices are up 13.2% on a year-to-year basis.
As I pointed out last Wednesday, the weekly analysis of many of the homebuilders had improved sharply suggesting that their correction was over as they had peaked last May. It is always a good sign when a group moves higher on bad news, and intra-day Friday, the iShares Home Construction (ITB) was up over 2.5% while the Dow was down over 100 points.
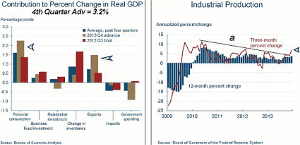
There was some good news as the advance reading on the 4th quarter GDP unexpectedly rose to 3.2% as exports and personal consumption made the largest contributions. Consumer Confidence also improved by 3.2 points and the University of Michigan Consumer Sentiment was better than its mid-month reading as it came in at 81.2.
The Chicago PMI on Friday also reflected expansion and the chart of the Industrial Production shows that the three-month % change has broken through its two-year downtrend, line a.
This week there is plenty of new data on the manufacturing sector with the PMI Manufacturing Index and ISM manufacturing Index on Monday along with Construction Spending. On Tuesday, we get Factory Orders, followed on Wednesday by the ADP Employment report. It has recently not been a good indicator for the monthly jobs report, which is due out on Friday. We will find out if last month’s poor jobs report was an aberration or not.
The ISM Non-Manufacturing Index is also out on Wednesday with jobless claims and International Trade on Thursday.
What to Watch
Even though we had the positive action last Tuesday and Thursday, it was a rough week for the bulls. After Thursday’s gain, the stock market was hit with heavy selling from the opening on Friday, though it did mange to close well above the worst levels. It may also be significant that the Spyder Trust (SPY) dropped below its quarterly pivot at $177.97 on Wednesday and Friday but did not close below it on Friday. To see how the other ETFs closed relative to their pivots, see 1st Quarter ETF Levels to Watch.
As I mentioned last week, those who were planning to buy the dip are likely past having second thoughts. Of course, this is what was needed to create a market environment where a strong new rally was possible. In just a week we are getting closer to these levels but I do not think we are there yet.
The number of bullish individual investors, as I mentioned Thursday, has dropped to 32%, down from 55% in just five weeks. The 10-day MA of the Arms Index has risen from overbought levels to oversold levels at 1.40 in the past week.
NEXT PAGE: Stocks
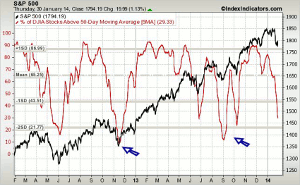
|pagebreak|The % of S&P 500 stocks above their 50-day MAs has really turned around as the five-day MA dropped to 37.64% on Thursday and will be even lower after Friday’s action. It will take a few days at least of positive action to turn the MA higher. It is now in the zone that has corresponded to the last two market lows.
Though the market’s momentum is still negative, it has now reached a better level in terms of risk. There were quite a few S&P 500 stocks after last week that were below their weekly starc- bands as I pointed out in 14 of the S&P 500's Weakest.
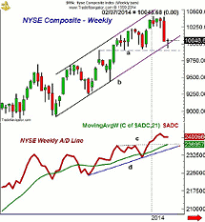
The NYSE Composite has reached the weekly support at 9900, line a, and did not close the week below its uptrend, line b. There is monthly pivot resistance now at 10,120-160, with stronger at 10,250. Last week’s close was just above the quarterly pivot at 10,082.
The weekly A/D is holding up very well, though the chart does not include Friday’s final numbers as the A/D ratios were just slightly negative on the close. The A/D is holding well above the breakout level, line c, and its rising WMA.
The daily NYSE Advance/Decline (not shown) is still below its flat WMA but is trying to turn higher. It needs a strong close above its WMA and then to develop a positive zig-zag formation to indicate that the correction is already over.
The McClellan oscillator dropped to a low of -167 on Monday and then formed a higher low on Wednesday before closing the week just above the zero line. This is an encouraging sign, though it normally bottoms out after dropping to -250 to -300.
S&P 500
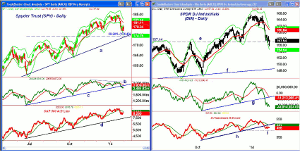
The Spyder Trust (SPY) dropped below its starc- bands last week, as well as the quarterly pivot before finishing the week above the lows at $176.88 that were made on Wednesday. The 38.2% Fibonacci support is at $174.43 along with the uptrend, line a. A strong close above the $180 level will signal a test of the 20-day EMA at $181.10.
The daily on-balance volume (OBV) has been acting weaker than prices since it peaked in November and formed lower highs last month, line b. The uptrend going back to the June lows, line c, has also been broken. The weekly OBV continues to act much stronger.
The S&P 500 A/D line did confirm the January highs before dropping back below its WMA. It is still well above the uptrend, line d, and the key support now is at the December lows.
Dow Industrials
The daily chart of the SPDR Dow Industrials (DIA) shows the beating it has taken over the past two weeks as it dropped well below the former breakout level, line e, at $157.40. It closed well below the quarterly pivot at $159.26, which now becomes first resistance.
The weekly starc- band was tested last week and now stands at $155.90. There is more important support now from early November at $154.87.
The daily OBV rebounded back to its flat WMA before the recent plunge, warning of weakness. The uptrend from the October lows, line g, has now been broken. The weekly OBV (not shown) has important support now at the September-October lows.
The Dow Jones industrial A/D line has also broken its uptrend ( line h) with next important support at line i. It needs a strong close above its WMA to turn positive.
Nasdaq-100
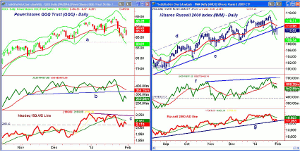
The PowerShares QQQ Trust (QQQ) closed the week near its highs and well above the quarterly pivot at $84.09. The low on Wednesday was $84.76 as the daily starc- band was reached.
The 20-day EMA is now at $86.94 with stronger resistance at $87.60 to $88.50.
The volume was heavy last week and the daily on-balance volume (OBV) has dropped below the support at line b, which now becomes resistance along with its declining WMA. The weekly OBV (not shown) is still holding above its rising WMA.
The Nasdaq 100 A/D line did not confirm the recent highs, line c, and is holding just barely above its lows. It is acting weaker than prices and a break through the negative resistance at line c is needed to turn it around.
Russell 2000
The iShares Russell 2000 Index (IWM) tested the quarterly pivot support at $111.44 and then bounced from Friday’s lows but was still lower on the day. The lower boundary of the trading channel, line e, was broken last week as the starc- band was tested.
The week’s low at $111.02 was quite close to the rising 20-week EMA at $110.81. The weekly starc- band is now at $108.69.
The daily OBV did confirm the recent highs before dropping back below its WMA, which has now turned lower. It has strong support at the November and December lows. The weekly OBV (not shown) is still well above its rising WMA so the OBV multiple time frame analysis is mixed.
The daily Russell 2000 A/D line did make marginal new highs with prices before reversing as it is now testing the support from last summer’s lows, line g. A drop in the A/D line below the December lows would be more negative.
The 20-day EMA at $113.97 is now first resistance with further in the $114.50-$115 area.
NEXT PAGE: Sector Focus, Commodities, and Tom's Outlook
|pagebreak|Sector Focus
The iShares Dow Jones Transportation (IYT) closed the week higher as the sharp drop the prior week was well supported. It is now down just 1.2% for the year, which makes it one of the best performers. It has held well above the quarterly pivot at $126.18.
A daily close back above the $131.50 area would set the stage for a test of the resistance in the $134-$135 area. A strong volume up day would support the view that the worst of the selling is over.
For 2014, it is still only the gold ETFs and the Select SPDR Health Care (XLV) that are in positive territory with XLV up 1%.
The Spyder Trust (SPY) is down about 3.5%, so far in 2014, while the SPDR Dow Industrials (DIA) is down 5.3%. Much better are the PowerShares QQQ Trust (QQQ), down 1.9%, while the iShares Russell 2000 Index (IWM) is down about 2.7%.
The Select SPDR Energy (XLE) is still one of the weakest, down about 5.8%, but as I mentioned Friday, crude oil is trying to complete a weekly bottom and some of the oil stocks are acting very well. This sector is entering a seasonally strong period.
In last week’s Where Will Strong Sectors Find Support?, I outlined the key support levels for the Select SPDR Health Care (XLV), Select SPDR Consumer Discretionary (XLY), Select SPDR Industrials (XLI), and Select SPDR Financials (XLF). If the daily momentum turns positive at these support levels, it should set up a good buying opportunity.
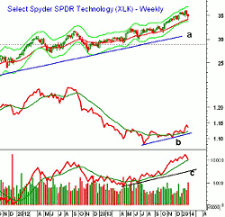
Also, I like the Select SPDR Technology (XLK) as it dropped down to test its 20-week EMA last before closing closer to the week’s highs.
The weekly relative performance shows a bottom formation, line b, which suggests it can be market leader in 2014. The OBV did confirm the recent highs and has now dropped back to its rising WMA. There is long-term OBV support at line c.
Interest Rates: The yield on the 10-year T-note continued to drop in line with the technical readings I discussed last week when yields closed at 2.77%. The yield on Friday was down to 2.67% and the daily chart shows a clear downtrend. The breakout level from last spring and next support is at 2.60%.
Precious Metals
The SPDR Gold Trust (GLD) and Market Vectors Gold Miners (GDX) held up quite well last week, but as I mentioned previously, I would still Buy the Miners Not the Gold. So far, there has not been a deep enough pullback to buy, but if this new range holds for a few more days, there may not be a sharper correction.
The Week Ahead
The volatility has been quite extreme over the past two weeks, which unfortunately helps to scare the individual investors out of the market or keep them from getting in at all. There are still no signs that the correction is over and typically it would last longer and go a bit lower than it has so far.
The overbought, too-bullish condition at the end of 2013 has been somewhat relieved and now we need to some signs that the daily momentum has turned the corner. I will be looking to get back in some of the sector ETFs once their technicals turn positive and this week’s action suggests we should be looking for a pullback to buy more of the homebuilding stocks.
I will also be looking to buy either the diversified European ETFs or some of the individual country ETFs as they are getting close to good support.
As I pointed out in A Path to Investing Success in 2014, those not in the market should have started their dollar cost average program in an S&P 500 tracking ETF on January 24 and adding another equal portion this Friday. This would be the second of the five I recommended. Of course, those who did not start on the 24th could also begin on Monday.
As for individual stocks, I think that those sectors that have done the best since the October lows are likely to be the leaders once this decline is over. More buy candidates are starting to turn up but until there is clearer evidence that the panic selling is over, I would not recommend being aggressive.
Don't forget to read Tom's latest Trading Lesson, 4 Picks from 3 Top Groups.
Editor’s Note: If you’d like to learn more about technical analysis, attend Tom Aspray’s workshop at The Trader’s Expo New York, February 16-18, 2014. You can sign up here, it’s free.

