
What is underway is a historic battle between U.S. monetary policy and the undeniable imbalances that typically emerge in a late-stage economic recovery, notes James Stack, a leading money manager with a "safety-first" investment strategy and the editor of InvesTech Research.
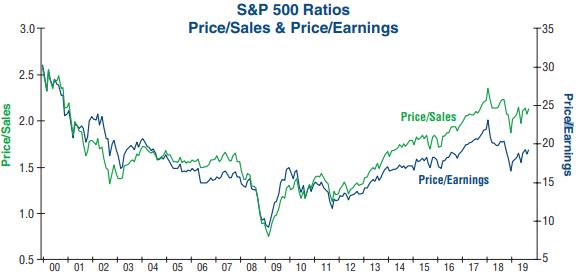
One positive note for this ongoing bull market is the Price/Earnings (P/E) ratio of the S&P 500 Index, which has come down considerably since the beginning of 2018. Today’s P/E ratio suggests that U.S. equities are a better value than they were for much of 2017 and 2018.
However, the S&P 500 has officially entered an earnings recession (two straight quarters of falling earnings), and FactSet earnings estimates are calling for an average -3.9% earnings decline for the upcoming third quarter 2019.
More from James Stack: Investing in an Aging Bull
Not all valuation measures appear as favorable. As shown in the graph below, the Price/Sales (P/S) ratio for the S&P 500 remains at a level rivaled only by the latter stages of the 1990s Tech Bubble.
For purposes of comparison, we removed negative earnings from the P/E calculation in order to remove distortion and highlight the relationship between the P/E (right axis) and P/S (left axis) ratios of the S&P 500. These ratios have historically tracked each other very closely.
In 2011, however, a dislocation began forming between the two, and by 2019 it had widened to the largest disparity on record. A deviation like this can be caused by tax reform, advantageous accounting adjustments, and other financial engineering that impact the bottomline — as revenues are not as easily manipulated as earnings.
It’s important to note that the last major dislocation between these valuation gauges occurred late in the prior cycle in 2007-08, with the divergence ultimately being resolved by falling stock prices. We would expect a similar outcome this time around.
It’s too early to know if the P/E ratio will remain at this more reasonable level, or if a continued drop-off in earnings will cause it to reinflate.
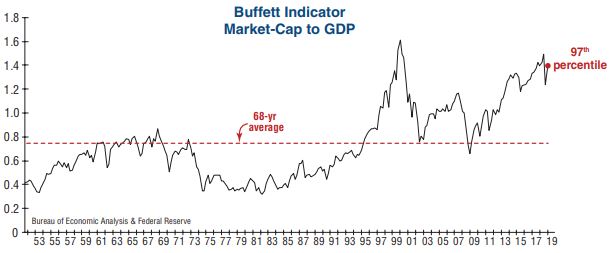
An alternative way of measuring value in the U.S. equity market is a calculation that has been dubbed “The Buffet Indicator” due to Warren Buffet’s affinity for this broad and relatively simple valuation metric.
See also: Small Cap Exposure with Global X Russell 2000 Cover Call ETF
This indicator is a ratio of total stock market value (i.e., total U.S. market capitalization reported by the Federal Reserve) to U.S. GDP. The most recent reading is near the unprecedented levels seen during the Tech Bubble of the 1990’s, which Buffett has often referenced when offering his insight on market values. In fact, the Buffett Indicator’s current level is in the 97th percentile of all readings over the past 68 years.
As with all valuation measures, the ones above –- Price/Earnings, Price/Sales, and the Buffett Indicator — are not useful market timing tools. No valuation metric can reliably forecast the future, rather it simply gives perspective on the present.
Even though equities may appear historically expensive, they can remain expensive for long periods of time. Extremes in valuation, however, do represent increased downside risk when a bear market does arrive.
Similar to the Tech Bubble, growth stocks are priced on lofty expectations and a continuation of today’s momentum. Ultimately, with history as our guide, value stocks should reemerge as market leaders, especially if stocks run headlong into a bear market.
While each cycle is unique, the eerily similar relationship between growth and value today versus the late 1990s reminds us this is not the time to reach for excess profits or momentum growth stocks. Moreover, portfolio positioning should look to capitalize on value segments of the market that are being overlooked by investors.
Subscribe to InvesTech Research here…
More From MoneyShow.com:


