
As regular readers know, we deal a lot in put/call and call/put ratios at SchaeffersResearch.com. One such ratio, which has earned several mentions in Schaeffer's Monday Morning Outlook, is the International Securities Exchange (ISE) equity only, call/put volume ratio. This ratio is comprised solely of buy-to-open equity options activity taking place on the ISE.
Dispensing with the introductions, Schaeffer's quantitative analyst Chris Prybal recently routed around a chart of the ten-day moving average for the ISE equity-only, call/put volume ratio. This chart highlights a couple extreme readings from the past month. Specifically, the ratio hit 2.5 (or 2.5 calls bought to open for every one put purchased in the prior ten days) just before the May correction. What's more, this ratio recently plunged to 1.5 in response to the recent pullback in the S&P 500 Index (SPX).
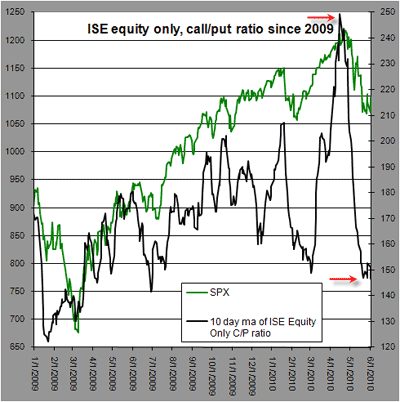
Click to Enlarge
You can see from the SPX overlay on the chart above that this ISE ten-day equity only, call/put volume ratio has a pretty good track record for mirroring movements in the SPX. As such, a rebound in this reading could mean that the SPX is ready to head higher once again. While the ratio is off its near-term lows, it remains to be seen if an actual uptrend has been established. According to Chris, "I would not characterize the ten-day average as beginning to turn higher. If anything, it is stagnant, albeit at the lower end of range. Neutral would be my short-term forecast."
By Joseph Hargett, contributor, Schaeffer’s Trading Floor Blog


