
Yesterday, I introduced the topic of ratio spreads. Today, let's look at some risk graphs and discuss the reasons for trading these spreads. It's a very appealing strategy and has a lot to recommend it. However, potential losses prevent this idea from being in the trading arsenals of more conservative option traders. Also, it should be avoided by inexperienced traders.
Let's take a typical situation. You anticipate a market rally (or fall) over the near term. Nothing major…perhaps 3-5%. You want to make a trade that makes a decent profit if your prediction comes true and are willing to lose money when you are wrong.
SPY is currently $120 (as I write this). Your expectation is that SPY may rally towards $125 by December expiration. The question is how to play that expectation?
There are many choices. The most basic play is to buy calls, choosing an appropriate strike. This is unattractive to some traders because the options may be priced too high or time decay may become too rapid. Alternatives include selling out-of-the-money (OTM) puts and put spreads or buying calendars, etc. However, this discussion is focused on ratio spreads and how to use them.
Each of those ideas has its good and bad points, and choosing a trading strategy is as much about market expectations as it is about the trader's individual comfort zone. Even when positions are known to produce identical results (equivalent positions), some traders are more comfortable when trading one strategy rather than another. We may all know that the results are the same, but if one type of trade makes you feel better, or helps you analyze the position with less effort, then it's better to choose that trading strategy.
Buy Call Spread
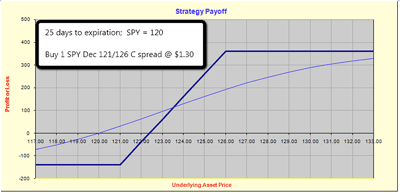
Choosing the specific option to buy is a discussion all by itself. However, let's assume that you have confidence in your expectations and buy SPY December 121/126 call spreads, paying $1.30 per spread (pay $1.62, sell at $0.32). The risk graph (figure 1; the thick line represents P/L at expiration and the thin line shows P/L for today) is as anticipated for a bullish spread. Thus, profits increase as the market rises, but reach a limit.
With a simple call spread, you earn the maximum possible profit when the market rallies and both calls are in the money when expiration arrives.
Click to Enlarge
The Ratio Spread
If you want to take extra risk to generate extra cash, instead of making a simple bullish play (buy call spread), you decide to sell extra calls.
If you have the confidence (or simply want to place the bet) that the market move will occur, but that it will be limited in scope, then the ratio spread can be advantageous.
In this example, let's sell one extra December 126 call for each debit spread bought. That means you will be short two December 126 calls for each December 121 call owned. Your anticipation is that those 126 calls will expire worthless, and backing that belief, you are willing to sell the extra call and collect an extra $32 in premium. (This is a fairly small premium considering the upside risk, but that discussion is for a later date.)
This play is not simply a matter of selling extra calls and cashing the check. Risk of loss is real. If you are not sure why this is true, it's too early in your options education to be trading ratio spreads. Risk is discussed below, but if this idea is new to you, it is better to avoid this play until you are better prepared to handle the risk management aspect of this strategy.
Article Continues on Page 2
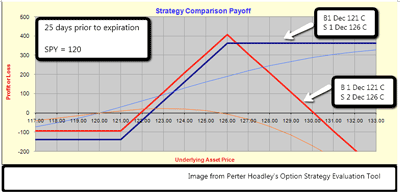
|pagebreak|Take a look at figure 2, which represents the profit/loss picture for the ratio spread. The red lines represent the ratio spread, while the blue line still traces the P/L profile for the debit spread.
Click to Enlarge
Whereas profits are never threatened when SPY rallies in figure 1, figure 2 illustrates a very different story. At expiration, profits reach their maximum when SPY is $126. However, what makes this trade so different from the simple debit spread is the rate at which those profits can disappear when SPY moves above 126. In fact, the graph indicates that all profits disappear when SPY reaches $130.
Let's consider why this is true. Your ratio spread consists of two separate positions—the debit spread and the naked short call. When you made this trade, you paid a debit of $98 per spread. (Paid $1.62 and collected 2 x $32). When the market moves lower, that $98 represents the maximum possible loss. This is illustrated by the horizontal red line when SPY is below $121.
When SPY rallies and reaches $126 (at expiration), the December 121/126 call spread reaches its maximum value of $5.00.
However, you are short one naked call option, and that's the December 126 call. The value of this option increases by $1.00 for every point that SPY rises. When SPY is $130, it is worth $4.00. That leaves you with a position worth $1.00. When you subtract the $98 that it cost to initiate the position, your profit has disappeared (OK, you have $2, before commissions).
If SPY continues to rise, your idea to own a bullish position has backfired because you underestimated the size of the move.
Tradeoff
That's the tradeoff. In return for collecting a higher cash premium, you accept the risk of being short one naked option. When that option moves in the money, it threatens to reduce and then take away all profits. And if SPY moves higher, losses mount at the rate of $100 per point.
By Mark Wolfinger of Options for Rookies


