Shares of the retailer have spiked following strong earnings, and option traders have swung into action. Here’s how one trader played it.
After the close last Thursday (Feb. 17), Nordstrom Inc. (JWN) posted a fourth-quarter profit of $232 million, or $1.04 per share, as revenue rose nearly 11% to $2.82 billion. Wall Street was expecting earnings of $1.00 per share on sales of $2.82 billion. JWN also guided 2011 earnings in line with expectations and announced plans to buy online sales marketplace HauteLook. The stock rallied nearly 2% following the report, tagging a fresh multi-year high and attracting a wealth of options activity to boot.
Puts were especially popular on JWN on Friday, with near-term volume on the typically bearish bets more than tripling the stock's average daily trading volume. Specifically, some 5,800 puts changed hands on JWN, with the then-soon-to-expire February 25 strike attracting the most attention. More than 2,800 contracts traded on the February 25 put, which expired at the end of trading last Friday.
While digging through JWN's options activity, I came across several blocks of puts that changed hands at the bid price. Additional research uncovered what appears to be a short straddle on Nordstrom.
Two Ways to Profit from This Trade
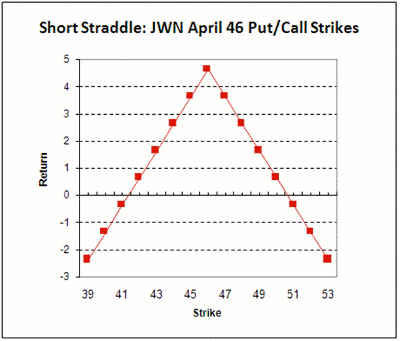
To construct the JWN short straddle, the trader sold 78 April 46 calls at 9:39 am ET on the International Securities Exchange (ISE) for the bid price of $2.54, or $254 per contract. At the same time, the trader also sold 78 April 46 puts for the bid price of $2.10, or $210 per contract. The result is a net credit of $4.64, or $464 per pair of contracts.
There are two ways the short straddle trader can bank a profit. The most lucrative path to profit occurs if JWN closes at the sold 46 strike when April options expire. In this scenario, both the sold 46 call and sold 46 put would expire worthless, allowing the trader to retain the premium of $464 per pair of contracts, or $36,192 for the entire position.
The second (and slightly more complicated) path to profit involves decaying time value and/or a drop in implied volatility. With the company's quarterly report out of the way, we could see implied volatility (IV) for JWN options begin to decline. Also, all options lose time value as they approach expiration, meaning that even if IV remains flat, the April 46 call and 46 put should decline in value as expiration draws near. In this scenario, the trader's profit is equal to the difference between the initial net credit received and the price of the options when the position is closed (i.e., the options are bought back).
As with all options strategies, there are risks involved. However, those risks can be quite substantial for short straddle traders. Theoretically, if the stock rallies sharply, losses are unlimited, as there is no cap to how high the shares can move before the trader is forced to buy back the sold calls or purchase the stock to fill the assigned call option. Meanwhile, losses on a downside move are capped at the strike price minus the premium received. In this case, the maximum loss, should JWN plunge to zero, would be $41.36 ($46 - $4.64), or $4,136 per pair of contracts.
Finally, there are two breakeven points for this position. They are calculated by adding and subtracting the net credit received to and from the sold strike. For the example, the breakevens are $50.64 ($46 + $4.64) and $41.36 ($46 - $4.64).
For a rough visual representation of this Nordstrom short straddle, see the chart below:
Implied Volatility
As noted above, implied volatility is another key factor to consider when entering a short straddle position, as a decline in implied volatility can be an alternate route to profit on the position. Since the trader is selling the options, he is looking for inflated premiums at the beginning in order to maximize the net credit on the trade. At the time of the trade, implied volatility for the April 46 call was 32.05%, while the implied volatility for the April 46 put rested at 31.89%. For comparison, the stock's two-month historical volatility arrived at 24.54% as of the close of trading last Thursday.
By Joseph Hargett, contributor, Schaeffer’s Trading Floor Blog


