
Add a new weapon to your options arsenal by mastering the bull put spread, which is particularly useful in navigating difficult market conditions or hedging existing shorts.
Managing open options positions is a critical dimension to trading, especially if you are an options seller. Here we look at the popular options-writing strategy known as the put credit spread, or bull put spread, and how to manage this type of trade with an effective stop-management technique. It can be helpful in navigating difficult waters, especially when faced with a market moving sharply against a short options position.
When the market moves down quickly, it is the best and worst of times for put-spread writers. It's the best of times because available premium for selling increases sharply. It's the worst of times because if you are already in a put spread, that spread can widen quickly, leading to unrealized losses in your trading account.
The Set-up
Let's begin with a review of the basic strategy using an example of a put spread on the S&P 500 stock index. For explanatory purposes, let’s go back a few years and assume it is currently mid-April 2005, when there was a recent selloff down to the 200-day moving average, accompanied with massive volume and extreme bearish sentiment (a situation not unlike what we have currently). As such, we feel that the selling has reached the end for now, and we might want to sell a put spread deep out of the money. The VIX index has risen dramatically over the last week, moving from near 11 to as high as 18, representing a more than 60% increase.
A Premium for Puts
A high VIX means big fat premiums available for selling, especially on the puts, where there is a reverse volatility skew that makes out-of-the-money puts relatively higher priced. In the trade presented below, the level of implied volatility on the S&P futures options puts is 14.6%, and statistical (historical) volatility is just 11.4%, so the options on these futures are currently selling at a premium to underlying volatility levels.
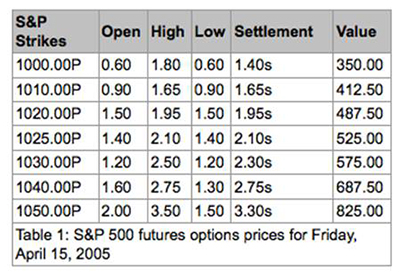
We could sell a May 1050 x 950 put spread, which has a lot of implied volatility pumped into it due to the selloff. In Table 1, you can view options settlement prices from the close of trading on April 15, 2005. These are option prices for S&P 500 futures.
If we were interested in selling the 1050 put, we could get about $3.10 (this takes two ticks off for the bid-ask spread). We would then buy the 1000 strike for about $1.60 (again, this is adjusted for the bid-ask spread). This would give us a credit of $1.50 ($3.10-$1.60). In dollar-value terms, we would have a net credit amount of $375 as each point of premium is worth $250. Commissions would reduce this some more depending on your commission price.
Click to Enlarge
This trade would cost us about $3,600 in initial margin, and if you follow the simple adjustment rules explained below, this margin should not rise above $7,500.
NEXT: Explore the Potential Outcomes for This Trade
|pagebreak|Outcome of a Bullish Move
The S&P June futures—which settled at 1143.60 on April 15, down 17 points in a big volume selloff— would have to decline another 8% to reach the short leg in our hypothetical put credit spread. By the current time in mid-April 2005, the S&P futures have fallen about 8% from the June contract's recent high reached on Mar. 7, 2005. So this provides a nice cushion. But there are no guarantees, and we should always assume the worst and have a plan to deal with it.
The market, for instance, could continue lower after we get into this trade, so how might we handle this? First, if the market trades higher from here going into late May, the spread will shrink fast and we will be able to take a profit. This is the ideal scenario, and if it does happen, we would, with the collected premium declining to zero at expiration, make a profit of just over 5% in 35 days (based on a double margin assumption, not counting commissions). A discount commission per round turn might be about $15 for each leg. Not too shabby a return for a month. This is why they call these spreads bull put spreads…they benefit most from bullish moves.
Outcome of a Decline
While these put credit spreads can even profit from a drop in the market, a large, quick decline may present a problem. In terms of current levels of volatility and time to expiration, which is May 21 (35 days ahead from our hypothetical present of mid April), this trade has a 99.3% chance of profit, according to statistical analysis (current level of statistical volatility is approximately 11.4%). In other words, there is just a 0.7% chance of the underlying futures settling below the short strike of 1050 on May 21. Those are pretty good odds, right?
Well, yes, but the devil is always in the details. The analysis above assumes we don't have our hand forced out by a large, quick move lower before expiration. The interim profit/loss picture looks good too: There's an approximate 88% probability of a smaller profit nine days into the trade, and 93% probability 18 days into the trade. Just how far should we let the market drop before we do something about this position?
Even though the odds are in our favor and there's a long way to travel before this spread gets into the money, letting a position like this get near the short strike or, worse, get in the money, is a definite no-no in terms of risk/reward. After all, this is a 50-point spread. If by expiration nothing is done, the trade will have a maximum loss of $12,500, minus the premium collected. Clearly, this is to be avoided at all costs.
Keeping It Safe
A good rule of thumb is to exit the spread if a certain predetermined level of the futures is touched. Some traders prefer a mental stop on the premium of the spread, but that poses certain problems, such as inadvertently permitting the position to get dangerously close to the strike of the short option just ahead of expiration. There is a less-than-3% chance of the position ever touching the short leg of the spread in the 35 days before expiration, but if we wait too long to adjust the position and happen to reach that level, the spread will have become too large to adjust in a swift down move.
Some prefer to use the first standard deviation level—which in this case is 1105, based on our current levels of historical/statistical volatility—as an adjustment point. There is a 63% chance of the position touching this level before expiration; this higher probability significantly changes the odds of the trade. Nevertheless, we want to be prepared to close the spread at this point. But first we reposition it with an adjustment known as “rolling for credits.” Let's look at what happens if the position reaches that first standard deviation level using a few simple assumptions.
NEXT: The Stop-Management Technique
|pagebreak|The Stop-Management Technique
We can make a number of projections about what will happen when we reach the first standard deviation (sigma) level. The longer it takes to reach this level, of course, the more time-value decay has helped us, perhaps even producing a gain if it occurs near the end of the expiration cycle.
You can see in Figure 1 that small losses occur in time frames T+9 and T+18. If we take the T+9 time frame, for example, and assume we reach the first sigma point within nine days of entering this trade, we show approximately a $375 loss on the position. This number would probably be a little more given additional increases in volatility, even though the long leg of this trade would somewhat help against a rise in implied volatility.
Click to Enlarge
Figure 1: May put spread with 35 days to expiration. Created using OptionVue 5 Options Analysis Software
At nine days into the trade, given the loss shown, a simple plan would be to simply close the spread (buy it back) and sell it again lower, but twice. This adjustment, however, would double our margin requirement to approximately $7,200.
Repositioning the Spread
There are two choices for repositioning this spread. We could sell it in the same month (May) or in June, which would allow us to go even lower to collect enough premium to cover the initial loss amount (about $375 in our example of an adjustment at T+9 days into the trade) and to cover the cost of the debit we incurred when we closed our first spread. Ideally, you would want to sell it in the same month.
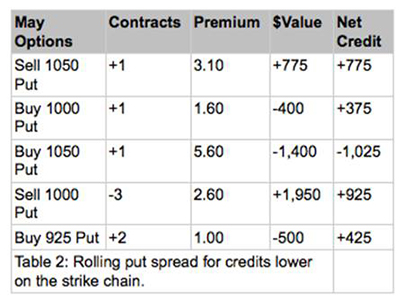
Let's look at how this trade would work out in terms of possible prices. For example, at the first standard deviation level about nine days into the trade, we have to pay approximately $5.60 to buy back the short 1050 put (a loss of $2.50). We then sell three May 1000 put options, which fetches us about $2.60 apiece (remember we were long one, so selling three leaves us short two).
We then roll our long May 1000 put lower and add another, selling at a strike low enough to make sure we have not lowered our initial total net credit, and ideally increase it if possible. Table 2 contains a log of these transactions and the likely prices that would have occurred, which result in a small increase in our original net credit.
The adjustments found in Table 2 show that we have increased our risk by doubling our position and widening the spread to 75 points between the short leg and long leg. That said, our short positions are now (at the present time of mid-April 2005) just over 100 points below the level of the June futures contract price (which has already fallen 38 points), which is assumed at this point to be at 1105 while our short strikes are now at 1000. We are safely kept far away from the money with this adjustment. In fact, based on original statistical calculations, we are beyond sigma three at 1029.80.
Click to Enlarge
Finally, if we should go lower again, you would need to buy back the two spreads and roll them out to the next month, even lower down the strike chain. This would lower risk because the additional time premium would allow you to go even farther down the strike chain than what would be possible in the May options.
A backup plan is to not let the spread price double. But remember there is a less-than-8% chance of the price hitting our first sigma level (the first standard deviation point of 1105) in the first nine days, so it is not like this happens every day. And by looking at Figure 1, you can see that at T+18, the loss-adjustment amount would be much smaller should we hit the first sigma level. Between T+18 and expiration (the solid line), a profit is showing. We would in this case still follow the rule to roll the position.
Bottom Line
Other ways to stay in these trades are to write calls to pay for the adjustments and provide additional downside profitability. But this gets tricky and is best left to professional money managers. The strategy we outlined here is a far simpler plan. In the long run, with an historical upside bias to stock markets, this strategy can really pay off, especially if you do these systematically every month and diversify across numerous markets.
By John Summa, CTA, PhD, founder of OptionsNerd.com and HedgeMyOptions.com


