
Rather than assuming the current low volatility is just the calm before an impending storm, Jared Woodard of Condor Options looks at historical trends that can give traders helpful short-term insights.
The market has not been this docile in more than eight months. The short-term volatility of the S&P 500 Large Cap Index (SPX) dipped below 10% in mid-January, and the market has kept getting quieter as stocks churn flat to higher.
The temptation when stocks get this quiet and options become this cheap is to assume that volatility will soon revert higher. But before speculating on rockier markets up ahead, it is worth looking back at how similar markets have fared historically.
Click to Enlarge
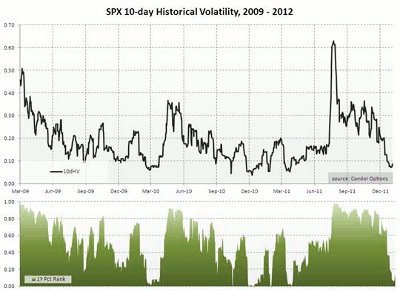
Fig. 1: SPX Ten-day Historical Volatility, 2009 – 2012. Source: Condor Options
To get a sense of just how calm equity markets have been recently, compare the sub-10% historical ten-day volatility for SPX to the last few years of market history. There have been four periods since the March 2009 market bottom during which SPX has traded with such lack of intensity.
In the first three cases, market volatility touched 20% within a month or less. In the final case, stocks stayed quiet from April to July 2011 before getting rowdy for the European banking crisis.
Fig. 2 below zooms in on the same data from January 2011 to the present. The lower panel in each chart shows the percentage rank of each day’s volatility estimate in relation to market data since 2001.
Click to Enlarge
Fig. 2: SPX Ten-day Historical Volatility, 2011 – 2012. Source: Condor Options
So far, the data seems to justify a short-term bet on increasing stock volatility. Options can certainly get cheaper, but they are already at middling valuations, and, as always, there is any number of macroeconomic and geopolitical scenarios that could generate some turmoil.
See related: Proven Ways to Hedge with Options
But before investors apply portfolio hedges or put on bearish bets, it is worth looking at how markets have fared price-wise in similar past situations.
The below table shows median SPX returns one, two, three, and six months later when the ten-day historical volatility rank has fallen below 10% (that’s the historical percentile rank of ten-day historical volatility, not the annualized volatility itself).
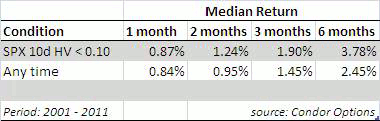
The first surprise is that the median returns are all positive. Quiet markets can precede tumultuous ones, but on average, they do not.
The second notable result is that market conditions like the present situation have, historically, offered better returns than the “any time” average one, two, and three months later. I checked for the worst subsequent returns at the same horizons, and the “any time” result was worse there as well: -18% one month later when volatility is this low versus -30% when the volatility requirement is removed.
If the past is any guide, the odds favor better-than-average upside returns in the near future, even if those returns are achieved at a somewhat more volatile pace.
Our practice in client accounts is to scale into portfolio hedges rather than apply them all at once, and that advice seems especially appropriate here.
As for speculative positioning, traders who want to bet on increasing volatility should do so from a market-neutral standpoint rather than taking on exclusively bearish exposure.
By Jared Woodard of Condor Options


