JW Jones of Options Trading Signals outlines three possible option trades that could be made around Apple earnings with defined risk.
Recently, I wrote about some of the fundamental concepts necessary to understand both the behavior of options in the approach to earnings release and their reaction to the actual release itself. Our example was Apple (AAPL), which indeed reported disappointing earnings on Tuesday, July 24.
We reviewed the fact that because of the risk associated with these events, many traders use options to define their risk and protect their trading capital. We posited three trades: bullish, bearish, and agnostic. I thought it would be instructive to return to those trades and assess how each would have performed for our hypothetical trader.
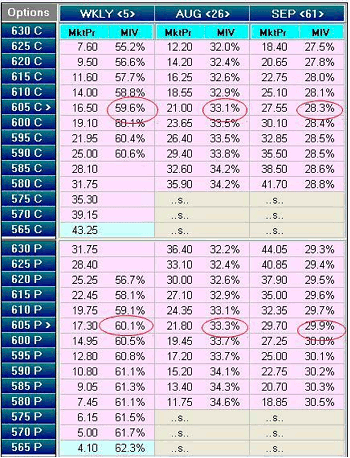
A major concept to understand in dealing with options is the behavior of the implied volatility. For the sake of review, let’s return to AAPL’s option board we discussed last week. The montage is posted below:
Note the implied volatility for the 605 strike call for not only what was the then front series ahead of earnings, but also for the entire series of options at this strike extending into the September series.
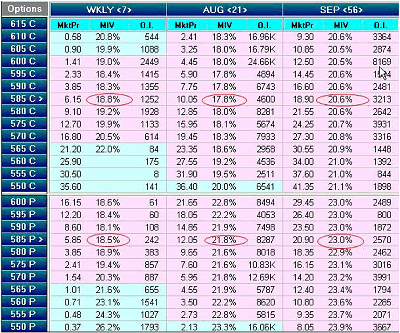
Now let us look at a more recent quote board and see the impact of earnings having been reported and removal of the uncertainty surrounding the impact of that event. The quotes after the earnings announcement are below:
The collapse of implied volatility is clearly seen here. The at-the-money strike volatility has shrunk to around one-third of its previous value!
Astute readers may be confused by the two different strikes chosen to assess the volatility levels in each of the two examples above. In the quotes from last week, we used the 605 strike options, and the current table uses the 585 options. Why the difference?
In order to make an apples-to-apples comparison, we will always use the current at-the-money options. This convention exists in order to minimize the effect of any volatility skew which may exist between the variously available strikes. Last week that was the 605 strike, and this week it is the 585 strike.
Now let us take a moment to review how well the option volatility predicted the magnitude of the price movement. Remember that the formula for calculating this prediction is the average of the front series straddle and the first out-of-the-money front series strangle. In our example, this calculation provided a value of $31.50.
In last Tuesday’s regular session, AAPL closed at $600.92. It had an intraday low on Wednesday of $570, or a decline of $30.92. I think this is a quite remarkable performance for an easily calculable value. Over a large series of individual predictions, this calculation has around 68% accuracy in predicting the size of movement on earnings.
|pagebreak|Now let’s return to our theoretical trades described last week in an attempt to see what we did right and what we did wrong:
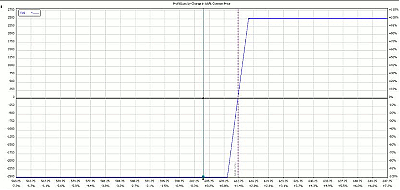
Our bullish trade was a call debit spread; the specific structure and projected P&L is graphed below:
This trade does not warrant a lot of discussion. It was a directional trade and the direction was wrong. All the options would have expired worthless at the bell on Friday, and the trader would have suffered a loss of the entirety of the cost of the position.
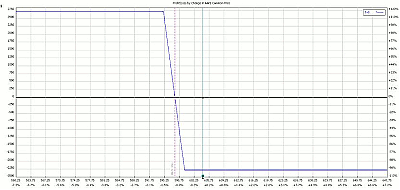
The bearish trade was a put debit spread. Again here is a P&L graphically:
This spread reached maximum profitability at the bell on Friday, since the short strike, 595, was never challenged following earnings. This spread was purchased for around $2.20 and reached its maximum value of $5 for a return of roughly 127% on maximum risk.
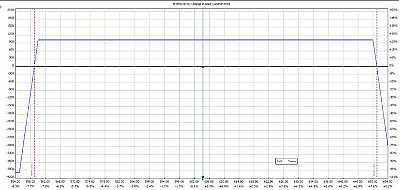
Finally, the Iron Condor we discussed had a broad range of profitability, and reflected the expectation that AAPL would move no more than 1.5 times the predicted move:
This condor could have been sold for a credit of around $1.06. The $1.06 sum represents the maximum potential profitability of the trade. Because both short strikes remained out-of-the-money, it achieved this maximum profitability and would have been allowed to expire worthless that Friday.
Return on maximum risk was the strike width of the wings, $5, less the initial credit received ($1.06), or $3.94. This represents a return of 26.9% on maximum risk.
These three trades looked at three examples of trading AAPL earnings using strategies with defined risk. The all or nothing approach is exemplified by the directional approaches, and is similar to strategies available to stock traders.
Our Iron Condor with a broad range of profitability with a lower potential profit—but high probability of profit—is an example of a typical options-based approach to earnings trades. I welcome questions and invite you to try our service at OptionsTradingSignals.com to gain more insight into some of these strategies.
JW Jones can be found at Options Trading Signals.

