JW Jones of Options Trading Signals explains how to produce long-term profits trading options on underlying stocks that have massive liquidity.
As a new options trader, it is easy to get confused. When approaching a trade, the stock trader has a simple binary decision: get long by buying stock, or get short by selling stock.
The options trader faces a host of potential trade constructions, including verticals, calendars, ratio spreads, and—perhaps most confusing of all—a wide array of complex spreads in which butterflies, condors, and iron condors can be created at will.
Even more confusingly, these complex spreads are easily mutated from one to another by simply adding or subtracting portions of their trade structure. Taken together with learning the concepts peculiar to the world of options, most notably the potentially confusing topic of implied volatility and its nuances, the aspiring trader can be easily discouraged.
In today’s missive, I want to look at an extremely simple longer-term trading plan that can produce substantial returns and is easily managed on a day-to-day basis. For this plan, I would like to use the example of one of my all-time favorite trading stocks, Exxon Mobil (XOM). This underlying has tremendous option liquidity, as indicated by having traded on average $8.6 million worth of options daily over the last few weeks.
In addition, Exxon’s options trade has bid/ask spreads of only a few pennies, and there is huge open interest in a wide variety of strikes. Taken together, these characteristics indicate that while price behavior may not always allow a profitable trade, a liquidity trap is not a risk factor.
In addition to these options characteristics, the stock pays a bit over 2% annually by virtue of its dividend. Finally, there is little chance that its fundamental business as the world’s largest producer of energy is going the way of the buggy-whip manufacturers anytime in the near future.
These facts provide reassurance to the investor that during times of this ongoing trade in which he is long stock, he is exposed to neither the risk of a collapsing business model nor is capital encumbered without receiving regular income via the dividend yield.
The trading plan can be adjusted to accommodate accounts with a wide range of capital, but in its simplest form consists of simply selling naked puts at the first out-of-the-money strike that have 25 to 35 days remaining to expiration. The potential outcomes are two:
- price remains above the strike price and we can close the position for a small debit
- price is below the strike and we take assignment of the stock
If the price remains above the strike, my strategy entails closing the naked puts when the trader has extracted 80% of the initial credit received when the puts were sold. Once the position is closed, we simply do it again and again, month after month.
The other potential outcome is that price drops below our strike price and we are required to buy stock at the strike price as the result of assignment. At this point, the most basic aspect of the trading plan dictates that we begin selling covered calls against our long stock, thus establishing a covered call position.
Since the stock would have decreased in price, implied volatility would have presumably increased, resulting in richer premiums for the calls we would be selling.
As long as we are in the position of owning stock, we are entitled to the dividends. The basic plan allows the stock to be called away if the calls go in-the-money. At this point, we return to the initial strategy of selling out-of-the-money puts with 25 to 35 days of life remaining.
Next: Let us look at the current status in order to consider a potential trade.
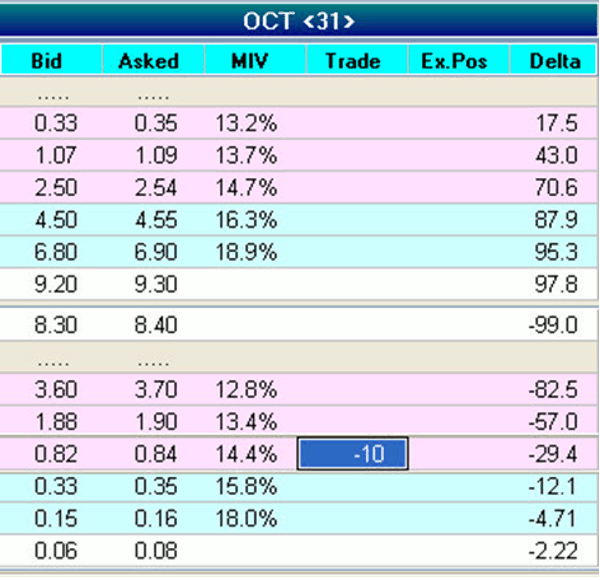
|pagebreak|Let us look at the current status in order to consider a potential trade. Below is displayed a current options montage:
The first out-of-the-money put in the October series, currently 31 days from expiration, is the $90 strike. We could enter this trade for 82 cents with a potential 5% return on capital based on margin calculated for a Reg T account. This trade has a 76% chance of profitability and a 70% chance of reaching maximum profitability.
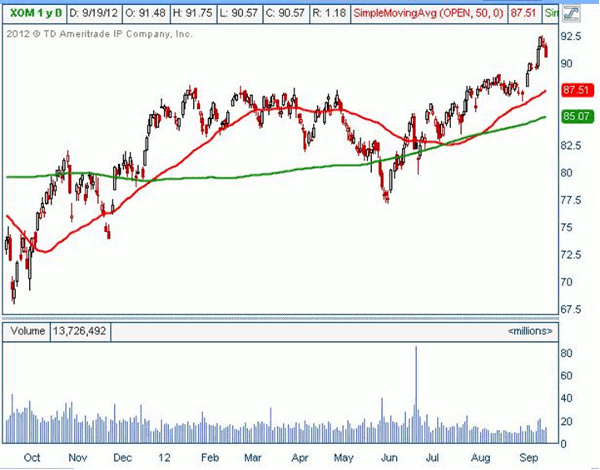
The nuances that could be applied to this trade are numerous, and would be reflective of the trader’s price hypothesis for XOM. For example, consider the daily chart of XOM displayed below:
The current price may seem somewhat extended, being well above the current 50-day and 200-day moving averages. The technical-driven trader may wish to sell the more conservative $87.5 strike, hypothesizing support at the recent area of consolidation.
Is this the elusive “free money” trade? It is not. But over a long series of trades, the overwhelming probability is a significant positive return.
Negative features to this trade include requirement of substantial capital to secure the ability to buy the stock should assignment occur. This could be addressed by using put credit spreads instead of naked short puts if capital is an issue.
This is but one example of using a carefully crafted option-based trade to deliver a high probability of success. I invite you to subscribe to a trial membership of my service at OptionsTradingSignals.com to learn more about probability-based option trading.
JW Jones can be found at Options Trading Signals.


