Despite posting record revenue and profits, Apple’s share price continues to slump, and Donald Pendergast of SentientTrader.com offers his analysis and trade ideas for the current environment.
If you're an avid chart watcher, you are no doubt well aware of the large-scale decline that shares of Apple, Inc. (AAPL) have endured over the past 18 weeks; it's dropped down as low as 435.00 on January 25, 2013, from an all-time high price of 705.07 on September 21, 2013, a plunge of more than 38%.
The selling in the stock has been particularly brutal over the past week, particularly as the stock gapped below the important 500.00 level. Technically-oriented traders search for valuable clues on the charts that may alert them to the onset of a low-risk buying opportunity, even as those more focused on the company's near- and long-term business prospects also seek an answer to the important question of "when is it a low-risk time to buy AAPL?" Here's a closer look at AAPL's daily cycles chart to see if the regular price cycles in this giant-cap issue are confirming if a major low has already been reached—or not.
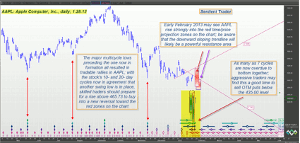
As a general rule, the more price cycles there are that bottom together, the more likely it is that a tradable rally will ensue in the days and weeks (months) that follow; we see that on AAPL's daily chart; rallies coming out of the May and July 2012 cycle lows were very strong and even the countertrend relief rally of November 2012 proved to be surprisingly energetic. In those previous swing lows, there were 4-5 cycles bottoming simultaneously, but now in late January 2013, it appears that as many as 7 price cycles have decided to crater together (in the green zones) and if the low of 435.00 was indeed 'the' low for the entire decline from 705.07, then it's very likely that AAPL will experience a bullish trend reversal, one that could easily recoup 38-50% of the plunge from AAPL's September 2012 high.
NEXT PAGE: How to Profit |pagebreak|
The red boxes on the chart show the most likely time/price targets for APPL over the next week to ten days; the 10-day cycle suggests that 483.00 to 533.00 could be reached by February 2, 2013, and the 20-day cycle anticipates that 474.00 to 502.00 could be achieved by February 5, 2013. The downward sloping trend line (based on cycle calculations) is also a very good indication as to where AAPL will face strong resistance, especially if the rally off the lows is very fast—which is a real possibility if AAPL shorts decide to cover en masse.
At the same time that AAPL's cycles chart is suggesting a high-probability of a bullish trend reversal, the medium-term Chaikin Money flow histogram (not shown) has also printed a very bullish price/money flow divergence pattern, one normally seen at intermediate term highs and lows. This also bodes very well for a strong rally into the 495.00 to 500.00 area, given that 7 cycles are already overdue to make a major low.
Despite the fact that AAPL has absolutely abysmal relative strength vs. the S&P 500 index (SPX) over the last 4-, 13-, 26-, and 52-week periods, traders and investors need to remember that in the financial markets—just as in life itself—things are usually darkest before the dawn of new days and new trend reversals, too. HPQ and DELL have already made major lows after truly incredible declines, and although it could take years—if ever—for those stocks to recoup their losses, the fundamentals for APPL are actually very bullish long term, unlike those for HPQ and DELL.
Traders may want to investigate the possible sale of out-of-the-money puts in APPL; the February '13 AAPL $430 puts are going for about 2.94 ($294 before commissions and slippage) and feature rapid time decay (theta) of $24 per contract/per day and have an open interest of more than 6,500 contracts. These puts will turn a profit at expiration as long as AAPL doesn't close in-the-money (below 430.00 at the close of trading on February 16, 2013) and one of the best confirmations that a sustained rally will happen is if AAPL breaks above 465.73 in the next few trading sessions. That would be a very opportune time to sell such puts, making sure that you don't risk more than 1 to 2% of your account value on the trade. Stock-only traders can also consider going long AAPL at the same breakout level; the use of a 2 to 3-bar trailing stop may prove beneficial in locking in gains even as it help limit losses; consider setting profit targets, if you are more conservative.
Donald Pendergast can be found at SentientTrader.com.


