Many bullish option positions are purely directional. When we buy call options, we win if the price of the underlying goes up; otherwise we lose, writes Russ Allen of Online Trading Academy.
There are many types of elaborations on the simple purchase of calls, such as the vertical, horizontal, and diagonal spreads; the butterfly; and the call ratio backspread. Each of these spreads just added one or more short call options to a basic long call position. The spreads were designed to maintain the bullish bias of the position, while bringing in some money from the short options to offset the cost of the long options. Each of these spreads has its place, depending on your degree of bullishness, and your outlook on implied volatility.
But besides their use as bullish trades, some of these same spreads can be used in a fundamentally different way.
First, let’s look at vertical spreads. In this case, we’re talking about the bull call spread, where we buy calls at one strike, and sell the same number of calls at a higher strike (same expiration). Instead of constructing bull call spreads so that the underlying’s price must go up in order to profit, we can put them together so that all the underlying has to do is not go down too much. Thus, instead of a directional, bullish position, the same type of spread can provide a nearly price-neutral position. Its profit then comes not from movement in price, but from time decay. This transformation comes by selecting strike prices where both the long and short options are already in the money.
With this strategy (in-the-money debit spread), although we don’t need it, we won’t mind upward price movement, no matter how high. We won’t mind downward price movement either, as long as it’s not too large. A very large downward movement is the only thing that can keep us from making our maximum profit.
Let’s look at Gannett Corp. (GCI). I selected this stock because its IV is quite high at this time. When we use bull call spreads as a neutral strategy, we will be short time value, and relying on time decay for our profit. So high volatility going in is a good thing as we are being paid a relatively large amount for the time value we’re selling.
For any strategy where we are net short time value, we want to take advantage of the rapid acceleration in time decay during the last 60 days or less of an option’s life. GCI has July options that expire in 37 days, within our 60-day window, so we’ll select that expiration.
NEXT PAGE: Bull Call Spread Payoff
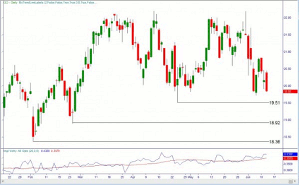
|pagebreak|Below is GCI’s price chart. It’s been in a range between $20.00 and 22.00 for a couple of months now. It has support levels below at roughly $19.50, $19.00, and $18.50. It’s reasonable to expect that it will hold above $18.00 for the next few weeks.
Figure 1 - GCI Price Chart

AAPL options chain showing minis
Click to Enlarge
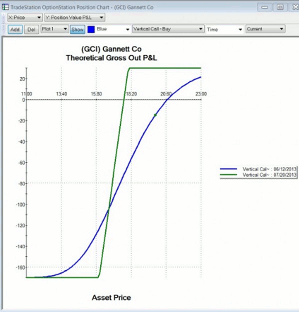
Looking at the option chain, we find that the $18 July calls can be sold for $2.30, while the July 16 calls can be bought for $4.00 (all option prices shown are at the midpoint between the bid and ask prices). The net cost is ($4.00 – $2.30) = $1.70. This debit to our account is the maximum that this position can lose. This maximum loss would happen only if GCI were below $16.00 at expiration, which is extremely unlikely. In that event, both options would be out-of-the-money and therefore worthless, and so would our position.
Our maximum profit would be realized if both options are still in-the-money until expiration. At expiration, all in-the-money options are worth exactly their intrinsic value, which is equal to the amount by which they are in-the-money. At any price above our $18 short call strike, both the $16 and the $18 calls will have intrinsic value. Since $18 is always exactly $2 more than $16, when both options have non-zero intrinsic value, their values must be exactly $2 apart. In that case, the spread will be worth exactly $2.00. Since we paid $1.70 for the spread, our profit will be ($2.00 – $1.70) = $.30.
Our breakeven price would be that price of GCI where we could recover the $1.70 cost by selling our long $16 call for that much; that is, the price where the $16 call is $1.70 in the money. That price is ($16.00 + $1.70) = $17.70. The payoff diagram for the spread is shown below:
Figure 2 - GCI July 2013 16/18 Bull Call Spread Payoff Diagram

AAPL options chain showing minis
Click to Enlarge
It may seem that the risk/reward ratio on this trade is not good as risking $1.70 to make $.30? But there are two additional factors we need to take into account.
First, we would not plan to hold this position if price dropped below the short strike at $18.00. At that price, if it occurred today, before any time decay has had a chance to happen, our loss would be about $.70 per share, not $1.70. With each day that passes, our short $18 call loses more time value than our long $16 call; Our P/L at a GCI price of $18 improves every day, eventually rising to our $.30 profit.
NEXT PAGE: Probability of Profit
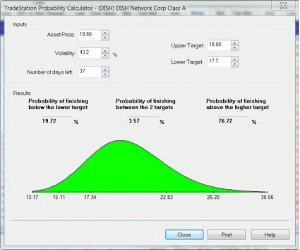
|pagebreak|Secondly, we need to take into account the probabilities of the important price levels. Based only on the current price and the stock’s volatility, an estimate of the probability of any price at any time in the future can be calculated. In the diagram below, I’ve calculated probabilities for 37 days out, which is the July expiration.
Figure 3 - Probability of Profit

AAPL options chain showing minis
Click to Enlarge
In the diagram above, the probability of being above $18.00 is shown as 76.72%. That means that we have a 76.72% chance of making our maximum $.30 profit. The probability of finishing below our $17.70 breakeven price is shown as 19.72%. So we have a 19.72% chance of losing money. Our chance of making some profit, not necessarily our maximum profit, is 81.29% (the 76.72% chance of finishing above $18.00, plus the 3.57% chance of finishing between $17.70 and $18.00). Not shown in this diagram is a 5.64% chance of GCI being below $16, in which case we’d make our $1.70 maximum loss.
So we have a 77% chance of making our maximum profit; an 80% chance of making some profit, and a 20% chance of losing money. That 20% includes a 6% chance of making our maximum loss.
These probabilities are calculated by a formula that cannot read charts. It therefore doesn’t know that there are multiple support levels above $18. We believe that the probabilities are even better than the formula calculates.
With these odds, the trade makes sense.
Experienced traders know that this bull call spread is equivalent to a bull put spread using the same strike prices. In this case, the $18.00 put could have been sold for $.45, and the $16.00 put purchased for $.15. The maximum profit is ($.45 – $.15) = $.30. In this case, (and it won’t always be true) that $0.30 profit is exactly the same as for the bull call spread. The maximum loss is the same as well at $1.70, and therefore the margin requirement is that amount, the same as the bull call spread. Both spreads profit from the greater time decay of the $18 call compared to the $16 call and are in all respects identical in their payoff and risk.
So a bull call spread, which is usually used as a bullish directional trade, can also be used as a neutral income-generating device that is based on time decay. This can be useful when a trader’s option approval level allows debit spreads (approval level 3) but not credit spreads (approval level 4). There are also occasions when differences in the specific option prices make a debit spread and the equivalent credit spread have different payoffs, rather than being identical as in this example. In that case the debit spread may be the better choice.
By Russ Allen, Instructor, Online Trading Academy


