Sponsored Content - The “VixVortex” was discovered as a result of recently completed studies on market volatility and the CBOE’s empirical data for the VIX from 2002 to 2021. The fourth VixVortex for the S&P 500 is currently in progress, writes Michael Markowski, director of strategies at AlphaTack.
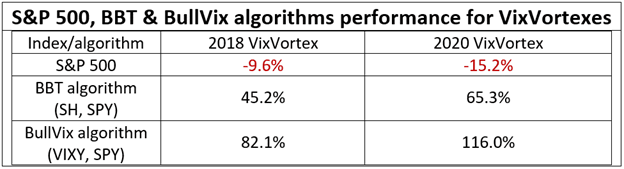
The minimum to maximum decline for the S&P 500 (SPX) would range from 11.8 % to 35.2 % based on previous VixVortexes. Trading VIX long (VIXY or VXX) and short SPY shares via BullVix’s signals will result in gains ranging from 82 % to 116 %.
A VixVortex is defined as the volatile-double-digit-percentage-decline-period that occurs after a stock index meets certain criteria, including the occurrence of a Bullish Sentiment Anomaly (BSA), etc. For more information on BSAs, click here.
With the discovery the BullVix algorithm has been programmed to:
- Identify a VixVortex occurrence
- Forecast the end date of the VixVortex
- Monitor the VixVortex to make adjustments to its forecasted end date, if needed
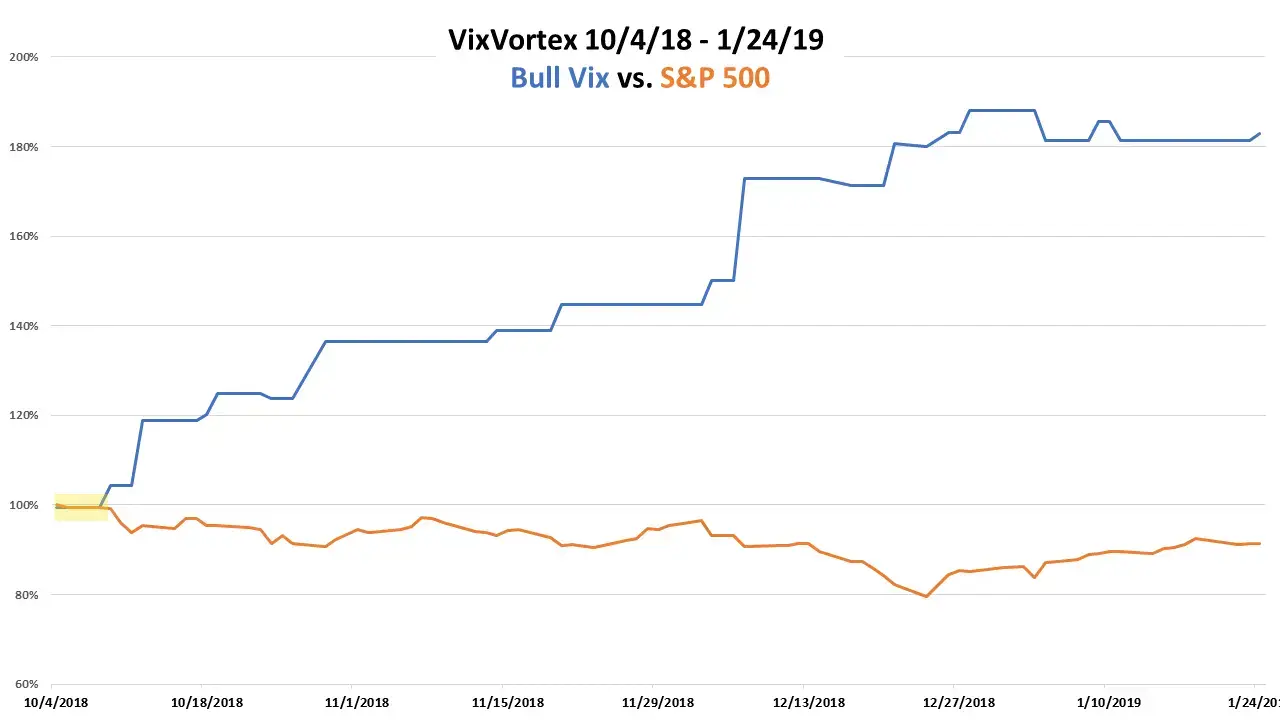
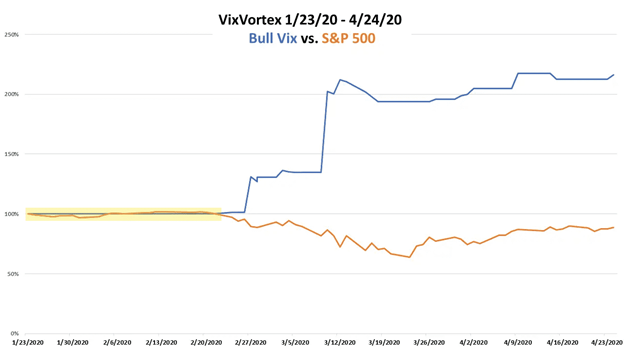
The importance of the VixVortex discovery is illustrated by the yellow highlight in the chart of the 2020 VixVortex below, as well as the charts for the other two VixVortexes at the bottom of the page. Before a surge in volatility happens, investors can now hedge their portfolios.
Even though the BullVix’s results for trading the VixVortexes were based on back tests, it is extremely reliable since it is a derivative of the BBT (Bull & Bear Tracker) algorithm.
For the three years ending March 31, 2021, the BBT gained 183 %, compared to 46 % for the S&P 500. The majority of the BullVix signals used to trade long and short volatility ETFs are a subset of the BBT algorithm’s signals. Some of the Bull Vix’s exit signals for VIXY and VXX are proprietary.
The table below depicts the performance of the S&P 500, BBT and BullVix algorithms for the two most recent VixVortexes.
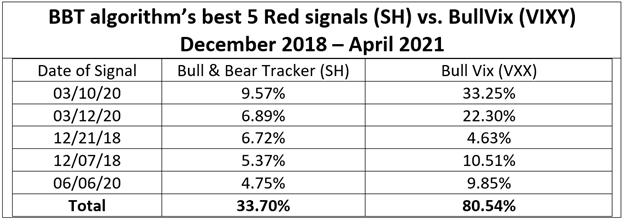
From December 2018 to April 2021, the table below depicts the actual gains for the BBT algorithm’s best-performing red or short-the-market signals. If the BBT had used BullVix’s VIXY shares instead of SH shares, its cumulative gain would have been 80.54% instead of 33.70%.
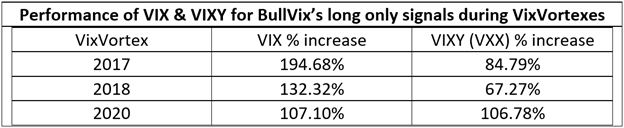
There is a theory that the price changes of the VIXY, VXX, and other ETN shares that resemble VIX futures contracts do not calibrate to the CBOE’s VIX. My research findings indicated otherwise. The win ratios for the VIX, VIXY, etc., which mimic VIX futures were identical for all three VixVortexes. For two of the three VixVortexes in the table below, however, the VIX’s gains were substantially higher than the VIXY’s:
The BullVix’s win ratio for the three previous VixVortexes ranged from 57 % to 66 %, which is not surprising given that the BBT’s win or performance ratio for its signals has traditionally averaged 60 %. The total number of signals and win ratios for each of the three VixVortexes are shown in the table below.
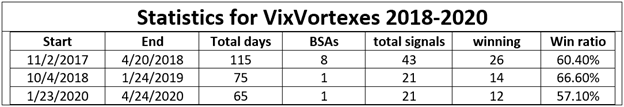
The 2017 VixVortex had twice the number of signals and a much longer duration than the 2018 and 2020 VixVortexes, as seen in the table above. Because of the eight BSAs that happened during the 2017 VixVortex, the end date was extended. The VixVortexes of 2018 and 2020 each had one BSA occurrence.
Since November 12, 2020, the long and short signals for the current VixVortex have produced a net gain of 3.8 %. The BullVix has had ten signal shifts, with a 50%-win ratio.
My research findings for the VIX and VIX futures and shares are conclusive. Excessive bullishness at market peaks builds speculative pressure to a level where only the occurrence of a VixVortex will relieve it.
Finally, based on my previous 2021 discoveries, the likelihood of the S&P 500’s 2009-2021 secular bull peak being reached before the end of the 2021 VixVortex is high. The secular bull will be replaced by a secular bear with a minimum lifespan of eight years and a 45 % decline.
Please watch my MoneyShow Virtual Expo presentation, Algorithms and Strategies Which Produce Short-Term Profits and Capital Gains in Up and Down Markets, on Wednesday, May 12, 2:10 pm - 2:40 pm. To register to attend click here.
.jpg)