
In part 1 of our commentary, we discussed the current Fundamental Gravity of our “Reflation’s Rollover” macro theme. If you missed part 1, I encourage you to read first, before part 2 here, writes Landon Whaley. He's presenting at MoneyShow Toronto Sept. 15.
We covered a great deal of critical fundamental developments, which are bearishly impacting crude oil-related equities and the US-listed ETF, the SPDR S&P Oil and Gas Exploration and Production ETF (XOP).
Quantitative Gravity says what?
As a quick reminder, the Quantitative Gravity component of our Gravitational Framework is not technical analysis, which is ineffective and misleading. Rather, we use quantitative measures based on the reality that financial markets are a nonlinear, chaotic system.
We’ve identified four primary quantitative dimensions of financial markets that affect price movement: energy (trend), force (momentum), rate of force (buying pressure), and a market’s irregularity (level of imminent drawdown risk).
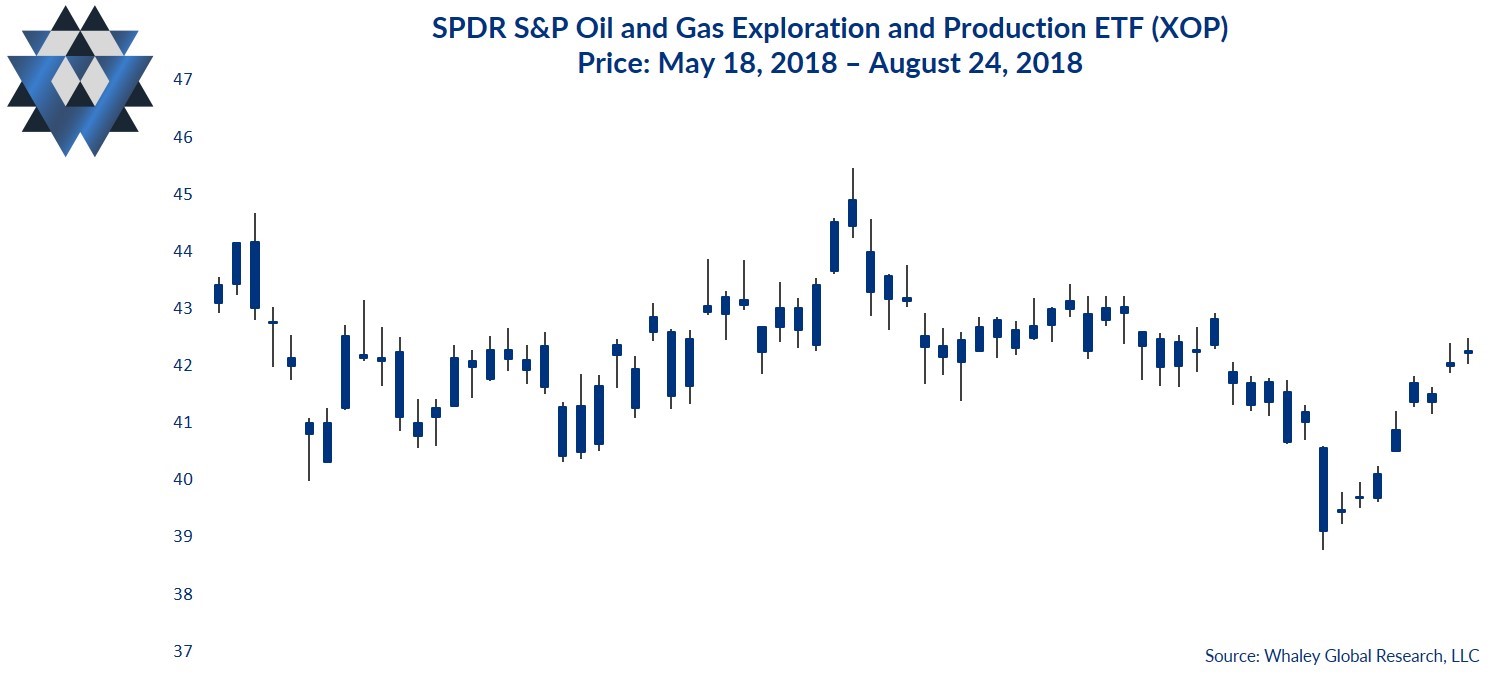
Social is our measure of a market’s current energy (or trend). XOP’s Social reading indicates it is in a full-on hangover. This bearish trend means that Social is completely aligned with its bearish Fundamental Gravity.
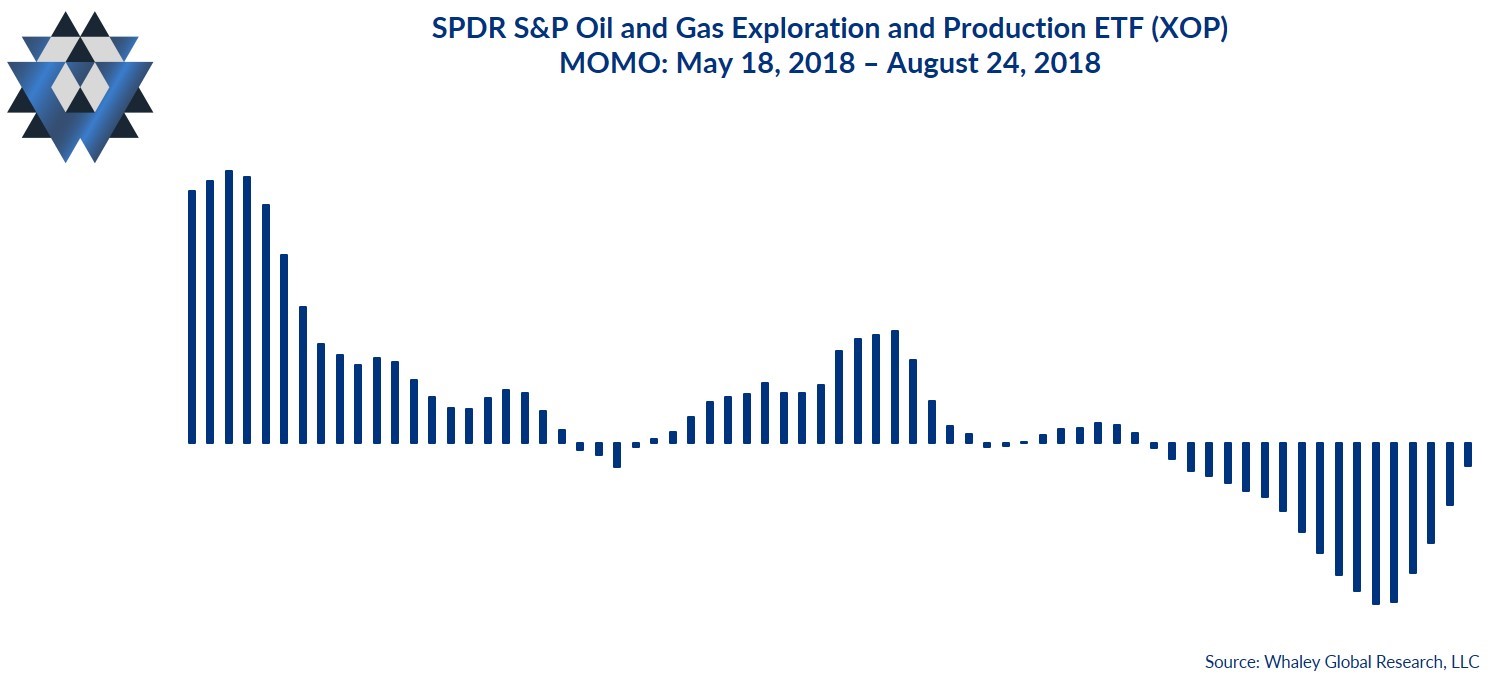
Momo is our measure of the amount of force behind the market’s current state. XOP’s Momo turned bearish on August 2 and is now giving us the most bearish reading since June 23, 2017! This, coupled with the current hangover status of Social, tells us that the most likely direction for XOP over the next one to three months is lower.
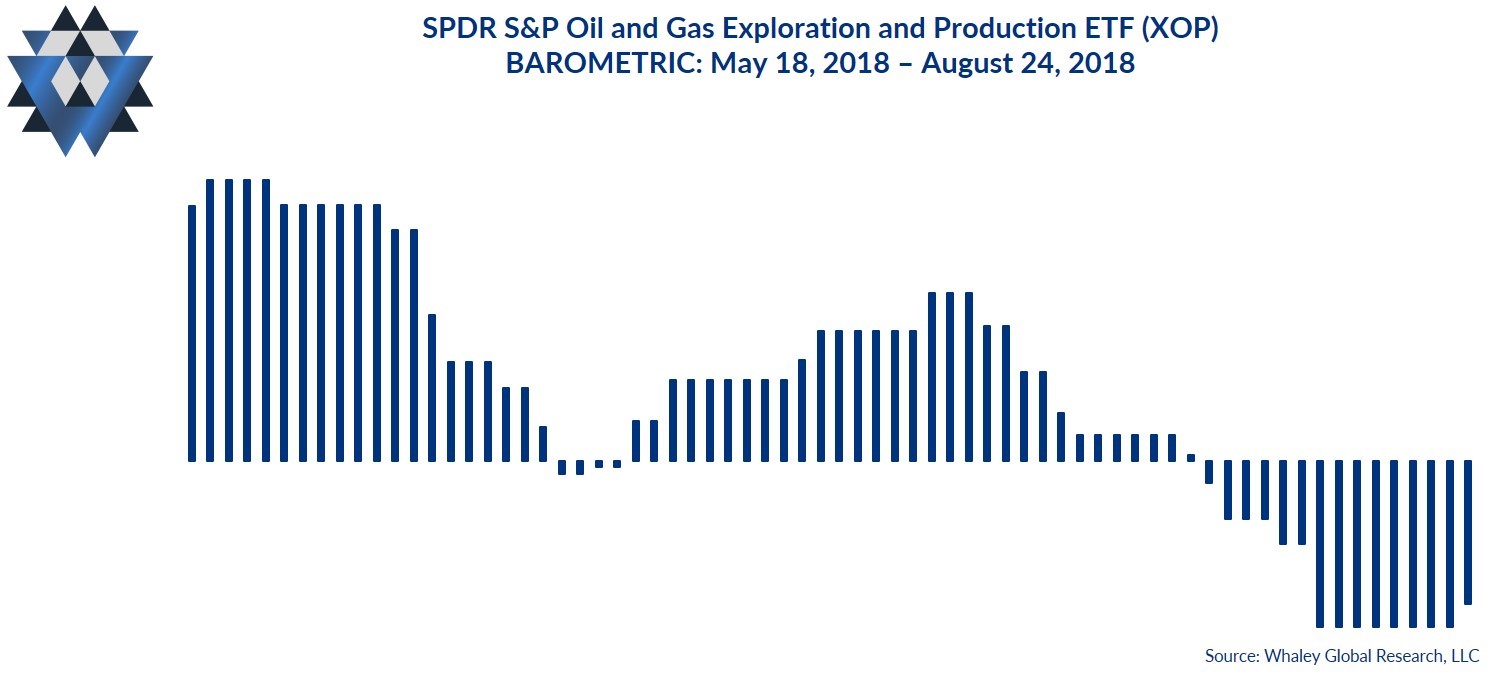
Barometric is our measure of the rate of force behind the current Momo. XOP’s Barometric indicates sellers have been in control of this market since August 7, and their bearish grip is getting firmer each day.
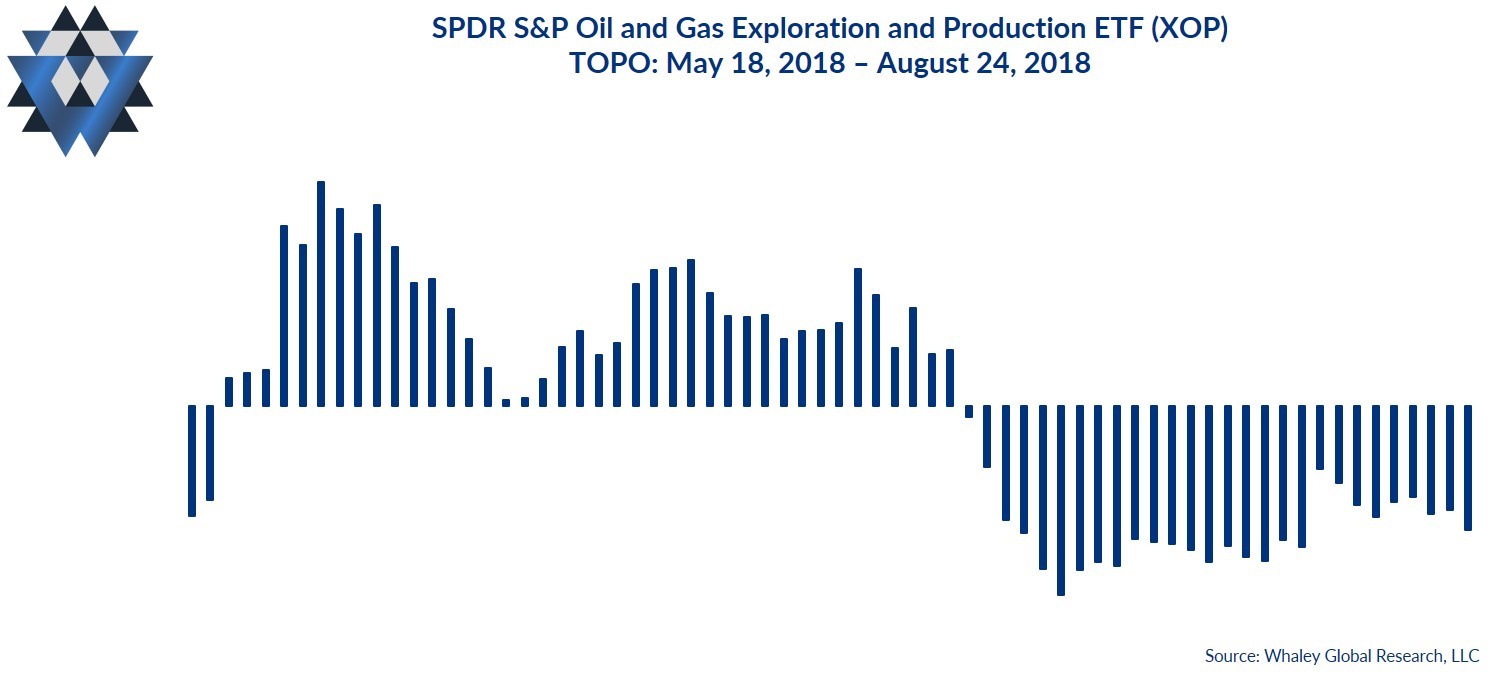
Topo, which measures the probability of a drawdown, is indicating a rising level of drawdown risk for XOP over the next ten trading days.
Most investors are hyper-focused on price action. Unfortunately, price is nothing more than the current point where there are equal parts of disagreement on value and agreement on price. If you’re new to our Quantitative Gravity framework, it’s important to note that the four quantitative dimensions of a market that we monitor typically move ahead of price.
In other words, price is the last aspect of a financial market to move, quantitatively speaking.
The Quantitative Gravity bottom line is that it doesn’t get more bearish than what we are seeing in XOP. Social and Momo are indicating that a bear market is just starting to cook, and Barometric is telling us that sellers have taken control of this market.
Behavioral Gravity says what?
Behavioral Gravity allows us to evaluate investors’ perception of this market and how that perception changes and shifts over time.
Since April, investors have added $366MM to the SPDR S&P Oil and Gas Exploration and Production ETF (XOP). Investors are ignoring the fact that XOP has been making a series of lower highs and lower lows (quantitatively bearish developments) since peaking on July 10. They continue adding money to this ETF because it’s been on a tear, gaining 22% over the last six months and 38% over the last twelve. But you can’t invest by looking in the rearview mirror; the investing game is played in front of you.
The Behavioral Gravity bottom line is that investors are chasing six-month and twelve-month returns by plowing money into XOP despite a bearish shift in the underlying U.S. Fundamental Gravity.
The Trade Idea
As long as XOP trades below $42.52, new short trade ideas can be initiated opportunistically on rallies. Depending on your entry and how much room you want to give this trade idea to move, use a risk price between $41.26 and $42.52. That said, your risk price line in the sand is $42.52. If XOP closes above that price, exit any open trades. If the trade moves in your favor and XOP trades down to the $37.04 to $35.73 area, consider closing some, or all, of your position.
In addition to providing detailed analysis and trade ideas like this commentary on a weekly basis, we also provide real-time email alerts whenever we add, or close, a position in our Asset Allocation model inside our Gravitational Edge report.
We are currently out of XOP in our Asset Allocation Model and will send out an alert if we get the right entry price that skews the reward-to-risk characteristics of the short trade in our favor.
Please email us at ClientServices@WhaleyGlobalResearch.com if you’d like to receive an email alert when we initiate our short EWY trade and participate in a an eight-week free trial of our research offering, which consists of three weekly reports: Gravitational Edge, The 358, and The Weekender.


